Our world continues to grow and evolve in numerous ways. We have been continuously expanding in the forms of economy, technology, and even population. The world’s population has become quite diverse with thousands of castes, races, ethnicities, religions, and other aspects as well. This makes the population of the world an interesting subject for study as well. Statistics from various studies and expert evaluations have concluded several aspects of the world population. We can learn more about it with the help of the following graphs.
Find Out More…
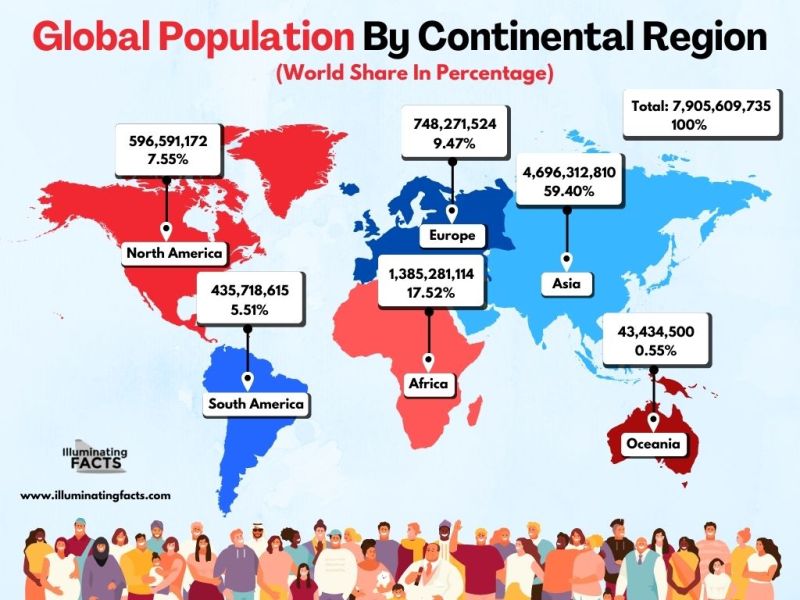
Global Population by Continental Region (World Share in Percentage)
The total population of the world has crossed 7.9 billion people out of which, the majority population is in Asia. Asia is the biggest continent which has over 4.69 billion citizens. This is about 59.4% of the world’s total population. Africa comes second in terms of the global population by continental region and accounts for 17.52% of the total population which is about 1.38 billion. The USA comes third with about 13% of the world’s total population which goes up to a little over 1 billion citizens. Europe is home to 9.47% of the world’s population at about 0.7 billion citizens while Australia / Oceania comes last with 0.5% of the world’s population with only 43.4 million people.
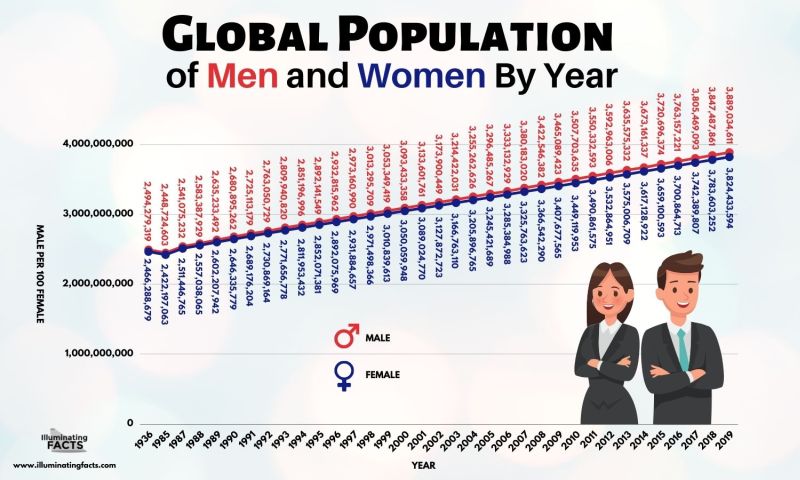
Global Population of Men and Women (By Year)
Year by year, the world population has constantly risen, and we can see that with the help of the global population of men and women statistics. In 1936, there were 2.49 billion males and 2.46 billion females in the world. By 1985, the number had slightly reduced to 2.44 billion males and 2.42 billion females. As of 2000, both males and females in the world had increased by more than 3 billion each. This was about a 1 billion increase in the total world population in just 15 years. In the next 15 years, by 2015, there were 3.72 billion males and 3.65 billion females which was about an increase of 1.37 billion. In 2019, there were 3.88 billion males and 3.82 billion females.
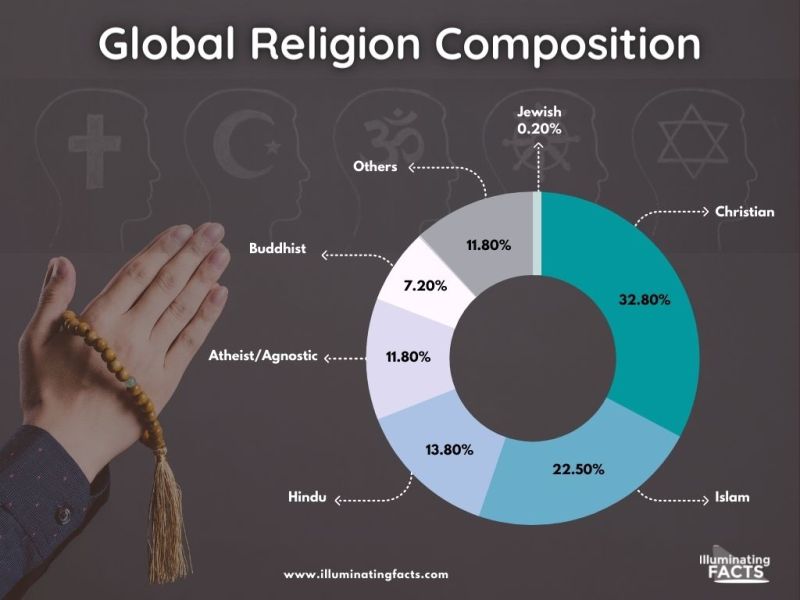
Global Religion Composition
The world is a home to over 4000 religions with many of them being variations of one religion. Some people don’t believe in any religion while others have different ethnicities. Christianity is the world’s most popular religion as 32.8% of the world believes in Christianity while 22.5% of the world’s population follows Islam. Hinduism is the world’s 3rd most followed religion with 13.8% of the world’s population following it. Other religions have a lesser number of believers which includes 11.8% of the world’s population. Simultaneously, 11.8% of the world is also a believer in Atheism, which means that they don’t follow or believe in any particular religion or the existence of God.
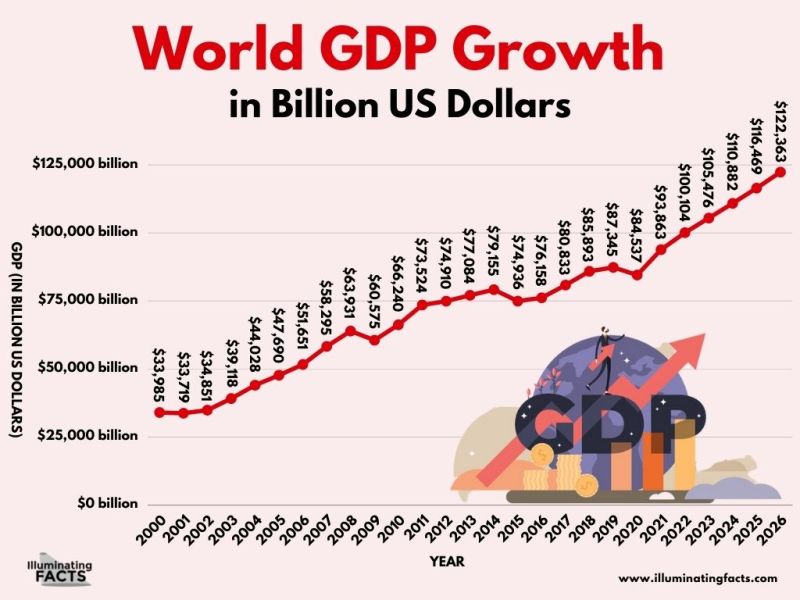
World GDP Growth (In Billion US Dollars)
The world has seen a sharp rise in the overall gross domestic product over the past many years. A major increase has been seen in the 21st century due to advancement, the arrival of social media, improvement in manufacturing techniques, and numerous other forms of economic policies. In 2000, the GDP of the world was $33,985 billion which reached 2x of this value in the coming 10 years. By 2010, the world GDP was $66,240 billion. There were minor dips and fluctuations but an overall positive trend was noticed in the coming years. As of 2022, the GDP of the world crossed $100,000 billion. Future trends show that it will be around $122,000 billion in 2026.
Largest Countries by Population (2020)
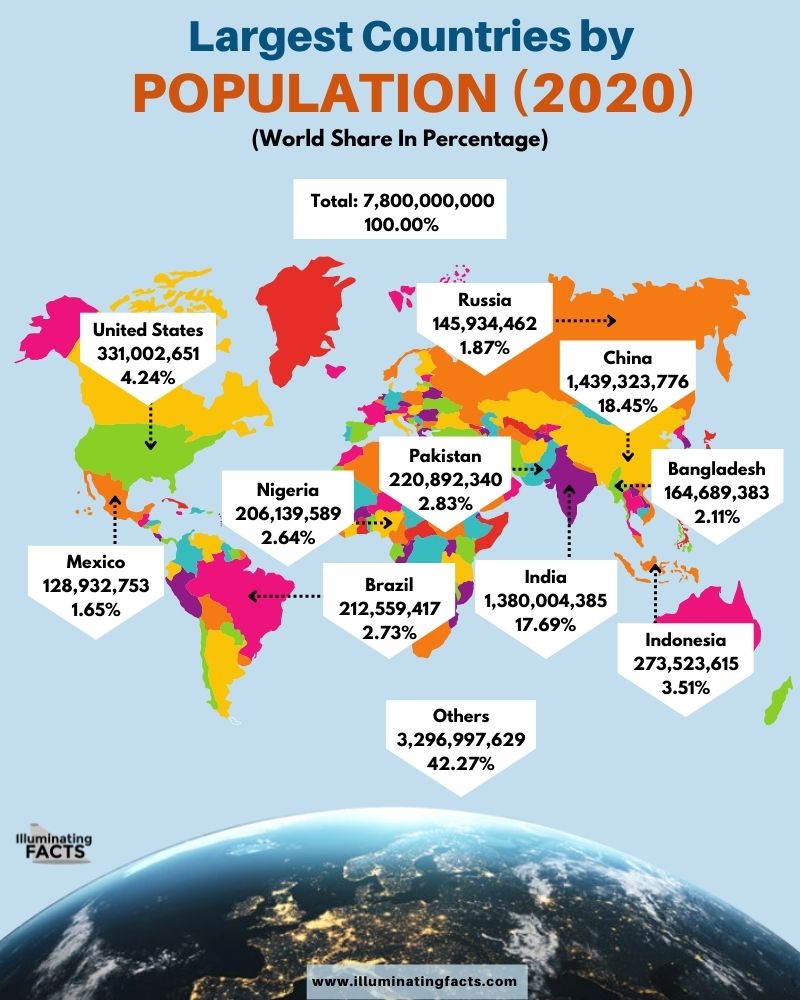
195 countries in the world make up the world population of 7.8 billion. Among these, China is the country with the largest population size. The country is home to over 1.4 billion people who make up about 18.45% of the world’s total population. This is closely followed by India which has 1.38 billion citizens that account for 17.69% of the total population of the world. The remaining countries of the world have less than a 5% share of the world’s population, each. This includes the United States, Pakistan, Mexico, Nigeria, Russia, Bangladesh, Indonesia, and others as well.
Top Countries by Population Density (2020) (Density in people per square kilometer)
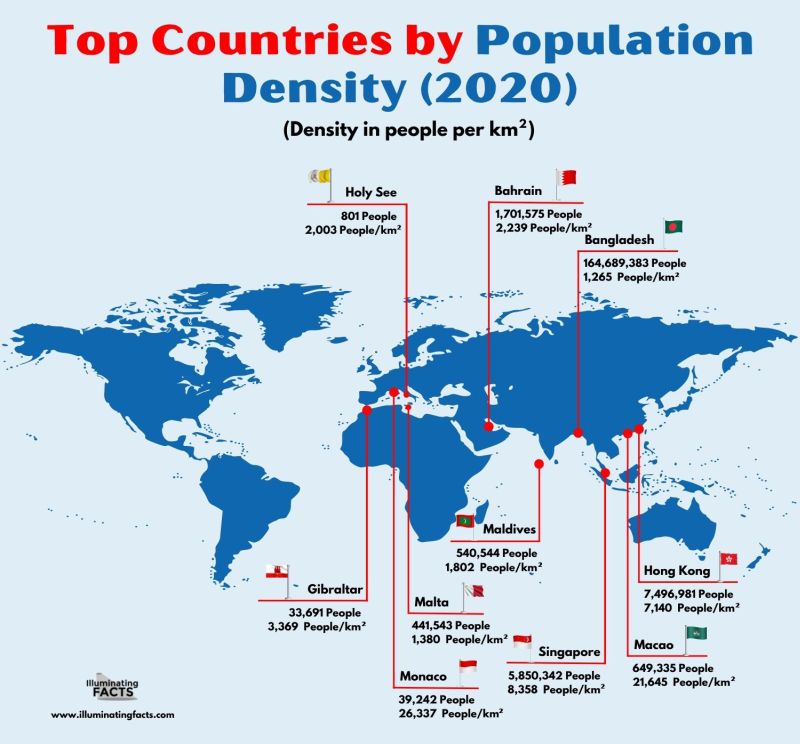
While many countries such as China and India have a high population, the population density in these countries is low. Population density refers to the comparison of population with regard to the area available to a country. Monaco is the country with the world’s highest population density with 26,337 people per square kilometer. The country itself is only 2.1 kilometers square. Macao comes 2nd with 21,645 people per square kilometer. The third-largest country in the world in population density is Singapore with 8,458 people per square kilometer. Other countries in this list include Hong Kong, Bangladesh, Maldives, Malta, Holy See, Bahrain, Bangladesh, and some others.
Annual World Population Growth Rate
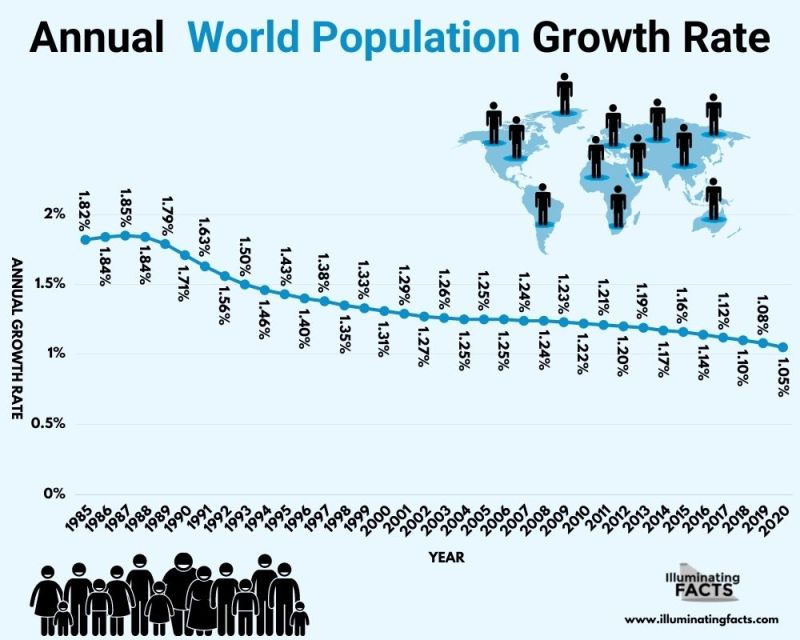
The world population has grown extensively, as seen in the graphs above. However, the year-by-year growth percentage has declined. This is mainly because of awareness campaigns as well as programs introduced by governments to avoid excessive population growth. In 1985, the annual population growth rate was 1.82% which reached a peak in 1987 at 1.85%. From this time, the annual world population growth rate kept declining. In 2000, it was only 1.31%. By 2020, the annual world population growth rate came down to 1.05% which is about a 40% reduction since 1985.
Life Expectancy (From 1770 to 2019)
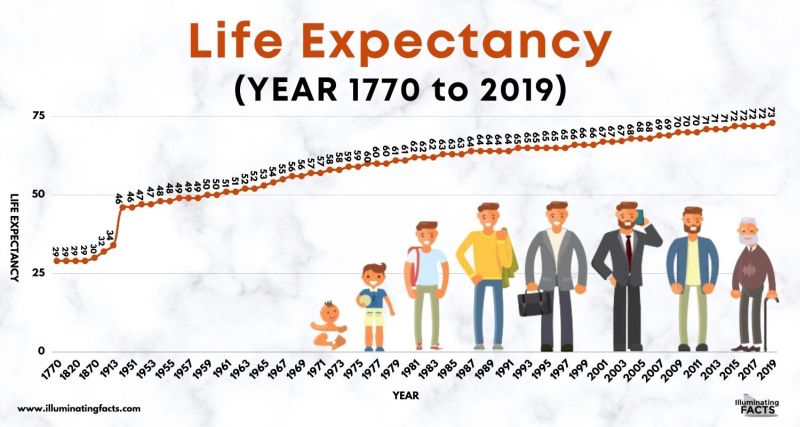
The life expectancy in the world has increased greatly in the past 3 centuries. This is mainly because there has been a vast improvement in medical science as well as technology in other fields which has improved the safety and standard of life for many. As of 1770, the life expectancy was only 29 years which only increased by 1 year in the next 100 years. By 1870, the life expectancy was 30 years. In 1913, it increased to 34 years. Since then, there has been a consistent rise in life expectancy. By 1951, it was 46 years. Fast-forward today, statistical data from 2019 shows that life expectancy has reached 73 years which is a major accomplishment.


