Cats are just one of the most adorable pets anyone could ever wish for. The purring sound, the fluffiness, and their ability to reach anywhere in no time is just too cute. Over the past few years, there has been an increase in the trend of keeping cats as domestic pets. Not only in the US, but we can also see the global rise in the different breeds of cats. As a result of this, the world of cats has become too big. Let’s evaluate the world of cats through numbers.
Find Out More…
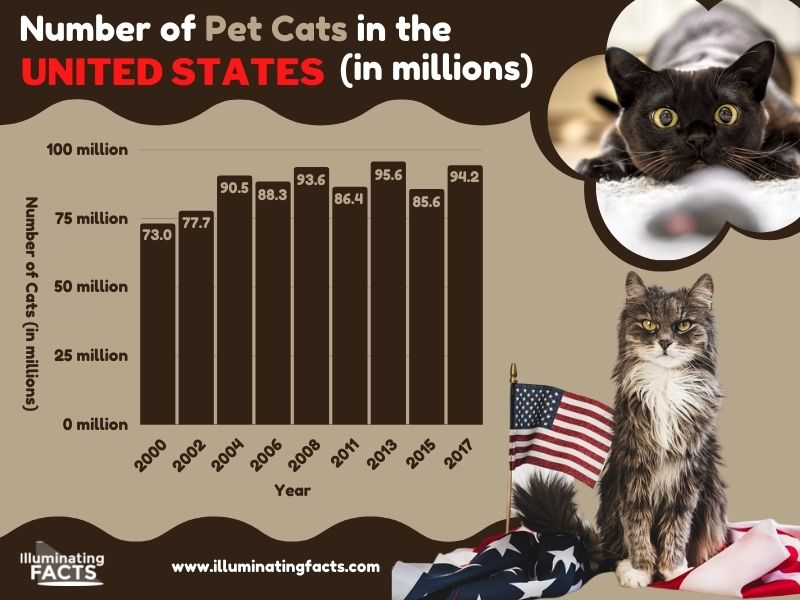
Number of Pet Cats in the United States (In Millions)
The US is one of the biggest markets for cats as a lot of people have kept them as their pets. This is why different types of cat food manufacturers are also based in the US. In 2000, there were 73 million pet cats in the US. This was an era where not many vets, cat products, and other essentials were available yet the demand for cats as pets was quite high. In the upcoming years, this number increased drastically. In 2013, there were 95.6 million cats in the US that were kept as pets. A slight decline was noticed in 2017 as the number of pet cats reached 94.2 million.
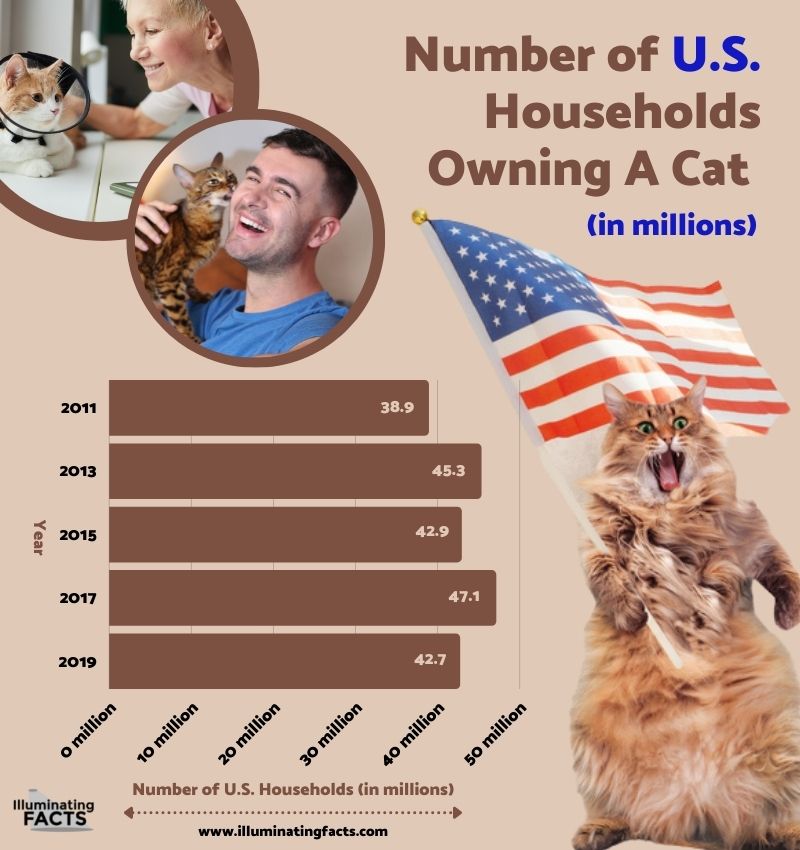
Number of US Households Owning a Cat (In Millions)
The USA has over 120 million households. According to several studies, more than half of them owe some kind of pet. From the data analysis, we found out that there has been a positive trend in the number of US households owning a cat as well. In 2011, only 38.9 million households owned a cat. 2 years later, in 2013, this number reached 45.3 million households. In 2017, over 47 million households owned a cat after which there was a decline seen in 2019 where only 42.7 million households had cat ownership.
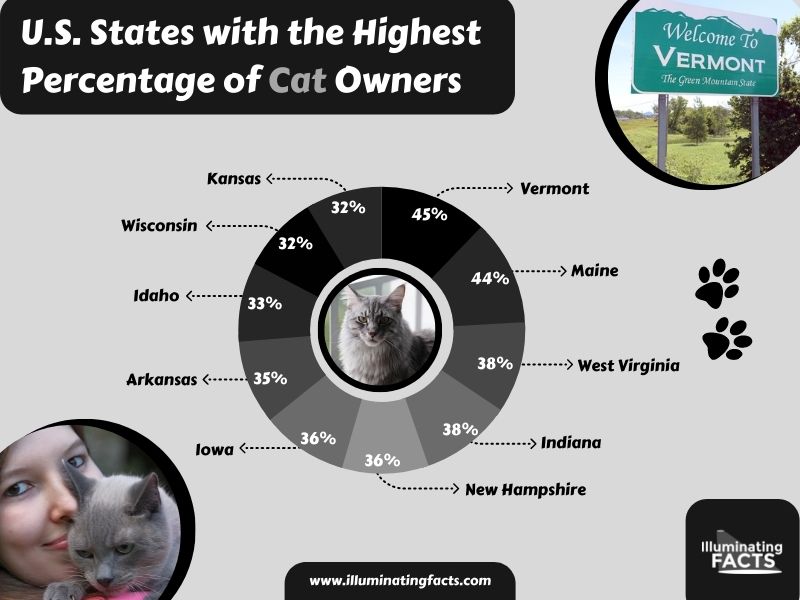
US States with Highest Percentage of Cat Owners
While it is true that the US is one of the biggest markets for cats and about one-third of households have cats with them, there are some states where cat owners are more than in others. From the graph, we can evaluate that Vermont and Maine are two of the cat-favorite states of the US. Vermont has 45% cat owners while Maine has 44%. West Virginia and Indiana are next on the list with 38% cat owners followed by New Hampshire and Iowa with 36% cat owners each. Other popular states of the US include Arkansas, Idaho, Wisconsin, and Kansas as well.
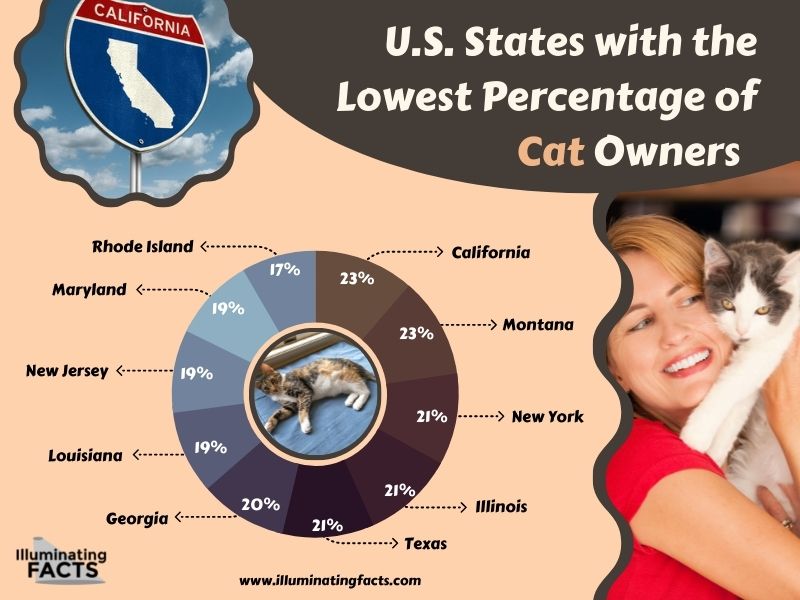
US States with Lowest Percentage of Cat Owners
There are some states in the US where there is either no trend of having a pet or there is not much of a preference to keep a cat as a pet. Many people prefer to have dogs instead of cats. Therefore, in states like Rhode Island, there are only 17% of cat owners. This is the least in any state of the US. Maryland, New Jersey, and Louisiana are also close with 19% cat owners each. Georgia has 20%, cat owners. Other states that have a minimum percentage of cat owners include Texas, Illinois, New York, Montana, and California as well.
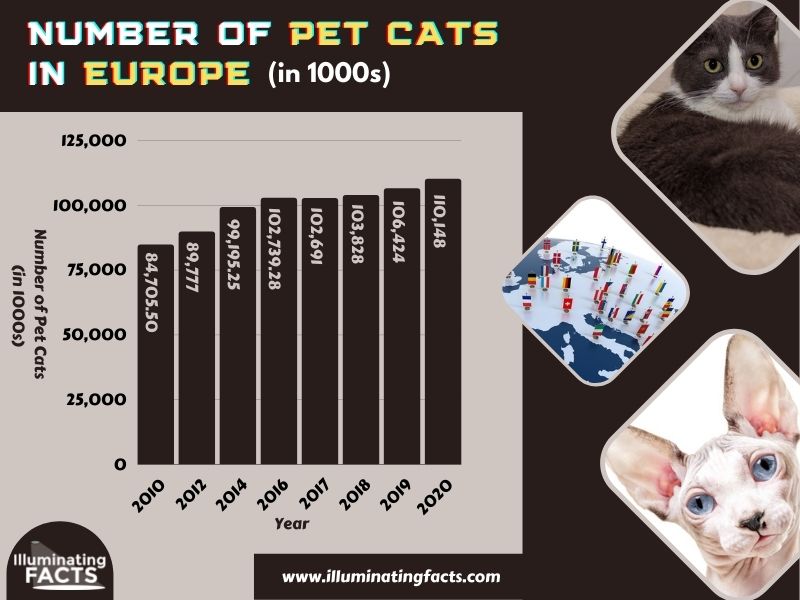
Number of Pet Cats in Europe (In 1000s)
Cats are not just popular in the US but are also quite famous in European countries. This can be seen with the rising number of pet cats in Europe. As of 2010, there were 84.7 million pet cats in Europe. The figure crossed 100 million in 2016 when the total number of pet cats in Europe reached 102 million. A gradual increase was then noticed in the subsequent years. In the next 4 years, a rise of 8 million cats was noticed which resulted in the number of cats in Europe as of 2020 is 110.14 million. It is expected that this figure will rise even further in the upcoming years.
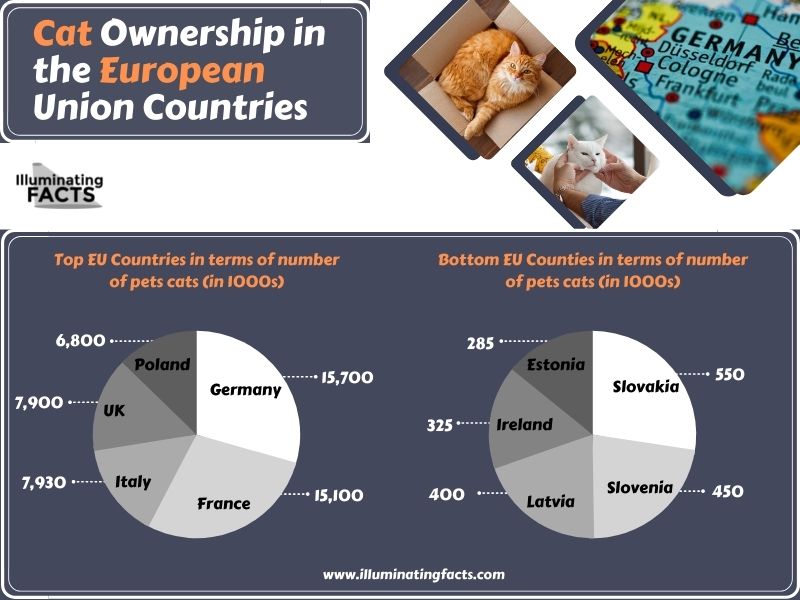
Cat Ownership in the European Union Countries
The cat ownership in European countries is quite erratic as some countries have less than 600,000 cats while others have more than 15 million cats. Among the European States with the most cat ownership, Germany and France are on top with 15.7 million and 15.1 million cats, respectively. UK, Poland, and Italy each have approximately 7 million cats. On the other hand, the European States with the least cat ownership include Estonia and Ireland with 285,000 and 325,000 cats only. Latvia and Slovenia have more than 400,000 cats each. Slovakia has 0.55 million (550,000) cats.
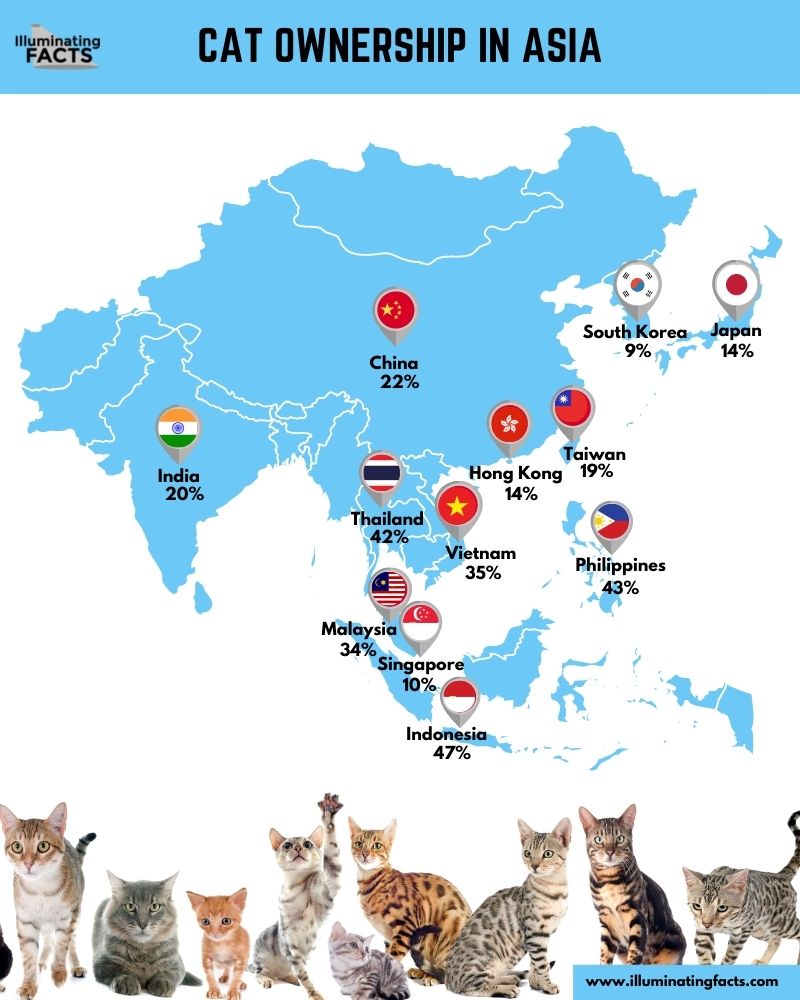
Cat Ownership in Asia
We have evaluated that there is a major trend of keeping cats as pets within the US. In the European Union, the trend is not that strong. In Asian economies, the cat ownership ratio is quite low. Only Indonesia and the Philippines have a high cat ownership ratio of 47% and 43%, respectively. Other countries such as Singapore have only 10% cat ownership. Despite being a large country, China only has 22% cat ownership. India is also close by to 20% cat ownership. South Korea has low cat ownership of 9% only, the least in entire Asia.
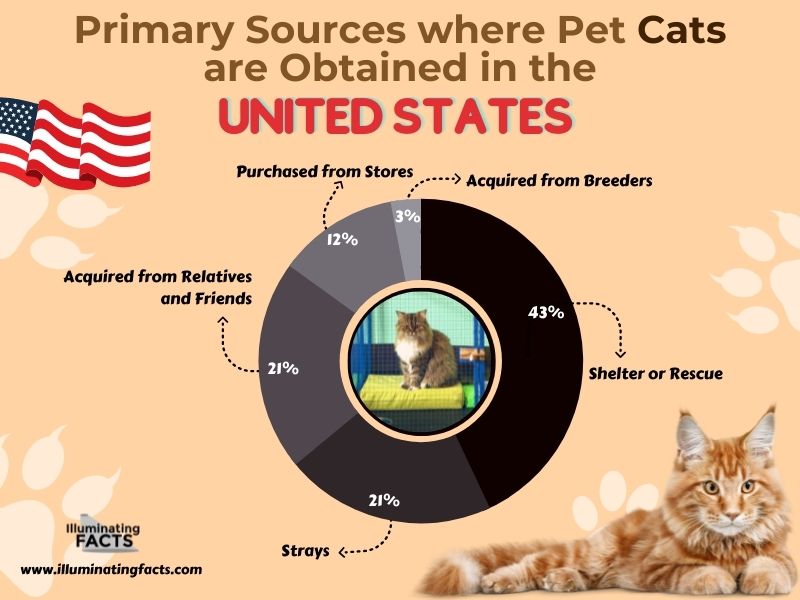
Primary Sources Where Pet Cats are Obtained within the United States
The US has a big fan following for cats and this is because there are several ways to obtain a new cat. This is what makes it easier to get yourself a pet cat. 43% of people within the US who have got their cats got them from cat shelters or cat rescue centers. These shelters have the cats well-fed and vaccinated with limited chances of carrying any disease. 21% of people have also got stray cats. Similarly, 21% of cat owners have acquired a cat from their relatives or friends. Pet stores account for only 12% of the cat acquiring sources while the least popular way is to get them from a breeder (3%).
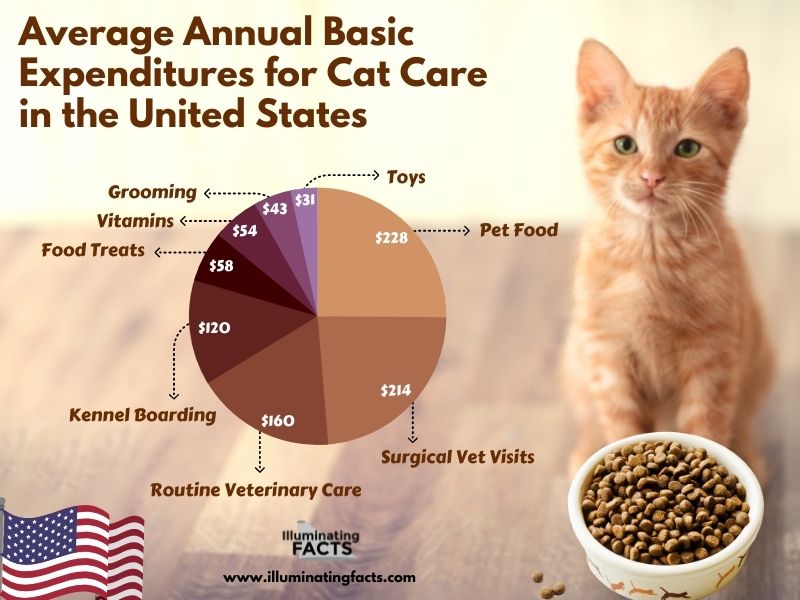
Average Annual Basic Expenditures for Cat Care in the United States
Cats may be a favorite pet for many but there is also a cost of keeping a cat as a pet. The average annual basic expenditures for cat care within the US are somewhere around $1000 per year. This is further categorized into several aspects. Primarily, the pet food and surgical vet visits account for the most expenses of cats. As seen in the graph, pet food costs $228 a year while surgical vet visits cost $214 a year. Routine vet care is also a major expense that costs $160 a year. Kennel Boarding could cost you up to $120 a year. All other expenses are comparatively quite low.

