Background
Our planet today has more than 7.9 billion people. In the next 25 years, it may have over 10 billion. The world could have way more by the end of the century, or it could start shrinking. With the many expert predictions out there, it all depends. However, it is pretty universally agreed that the population of humans will continue to grow in the near term. Based on some estimates, there could be around 14 billion people on Earth by 2100.
The rising number of people on our planet should not be surprising for anyone alive for the last century. It was in 2011 when the world crossed the 7 billion people mark, which was double the global population only 43 years before that. It means that 3.5 billion people were added in just 43 years. The global growth rate is also accelerating, as the world is adding another billion people every 12 years. [1]
Humanity took 200,000 years to reach the first billion people, but after that, it only took 200 more years to hit the 7 billion mark. Did you know that in 2019, the population of the world is 1,860 times what it was 12,000 years ago, which was only 4 million? [2]
When it comes to learning about the population or people on Earth, we sometimes talk about where humans came from or where we all might be going. There are also times when we research how we are all related, how we interact and communicate, or how we form relationships. Many are also exploring what it means to be a human and whether we are all alone in the universe. We have spent so much time trying to figure out what really matters most in one short lifetime.
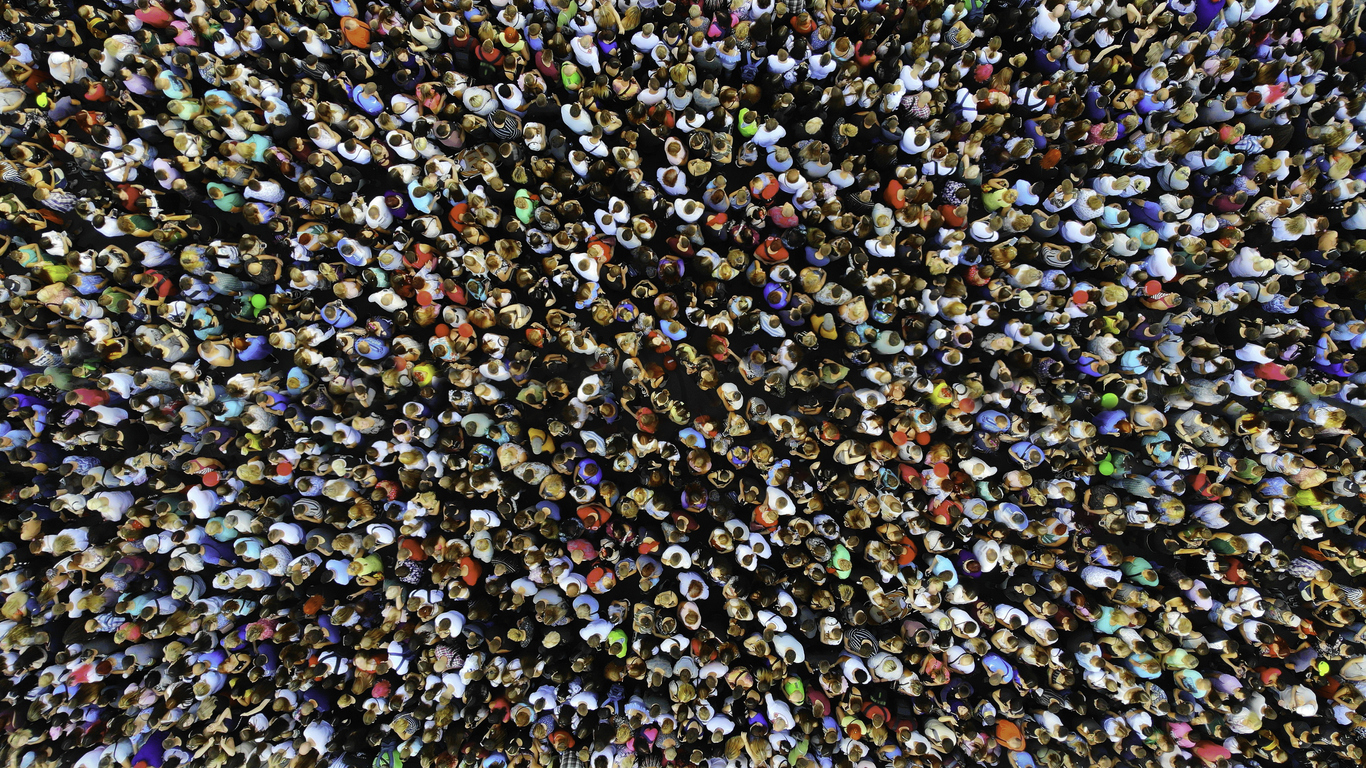
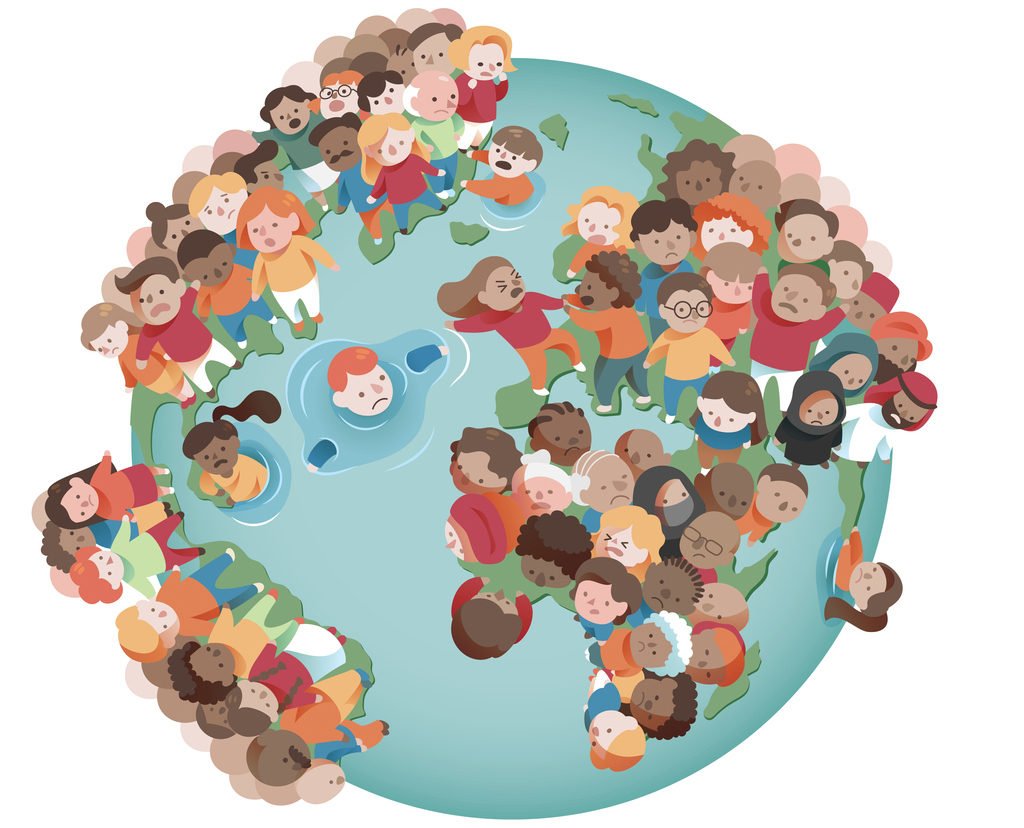
There are many topics that the population of people on Earth can cover. But have you ever thought about visualizing the number of people in the world? It’s easy to read that there are more than 7 billion people on Earth. But what does that look like? For instance, can you imagine how big a building is needed to fit all 7 billion people in it? That’s quite interesting to think about, right? [3]
If you want to learn more about it, read on as we’re giving you different ways to visualize the population of people on Earth, along with interesting statistics about the peoples of the Earth.
Visualizing the World Population
According to the United Nations, the world population will reach 9.6 billion by 2050, which is nearly 2.5 billion more people on Earth compared to what we have now. Overpopulation is something that triggers images of the apocalypse, even though nothing in human existence seems more repetitive than birthing a child. If you want to visualize the population on our planet, continue reading below.
Seven billion people is a lot of people. In 2015, the site Wait But Why created representations of the world population through various things:
People as Grains of Sand
If each of us were characterized by a dry grain of rice, the rice would fill a box with a side of 6.1 meters or about 20 feet, which is the size of a two-story house. That is a lot of rice grains, right? How about seven billion grains of sand?
PEOPLE REPRESENTED BY GRAINS OF SAND |
||
| Type of Sand | Size | What would 7 billion of it fill? |
| Very Coarse | 2mm in diameter | a large cubic room with a height of 13 feet |
| Medium-Sized | .25mm in diameter | a medum, 1.5 feet high cardboard box |
| Finest | .0625mm in diameter | a 2-liter soda bottle |
Well, there are different kinds of sand. For instance, very coarse grains of about 2 mm in diameter would fill a very large cubic room with a height of 13 feet. Medium-sized grains are around .25mm, and 7 billion of them would fill a medium, 1.5 feet high cardboard box. Lastly, 7 billion of the finest sand grains that are .0625mm would take up around 1,700 cubic centimeters of space, almost filling a 2-liter soda bottle. [3]
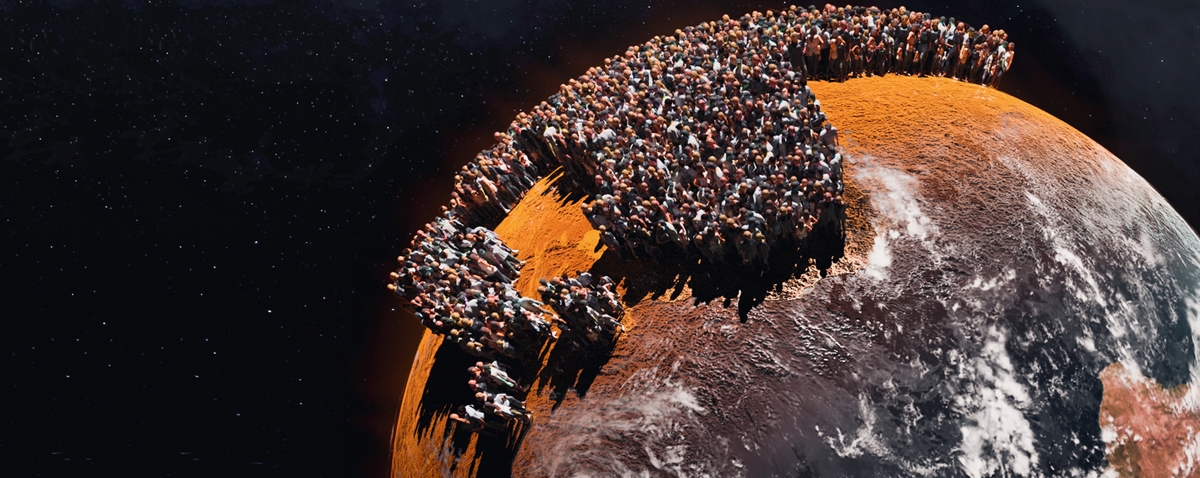
All People Forming a Huge Circle
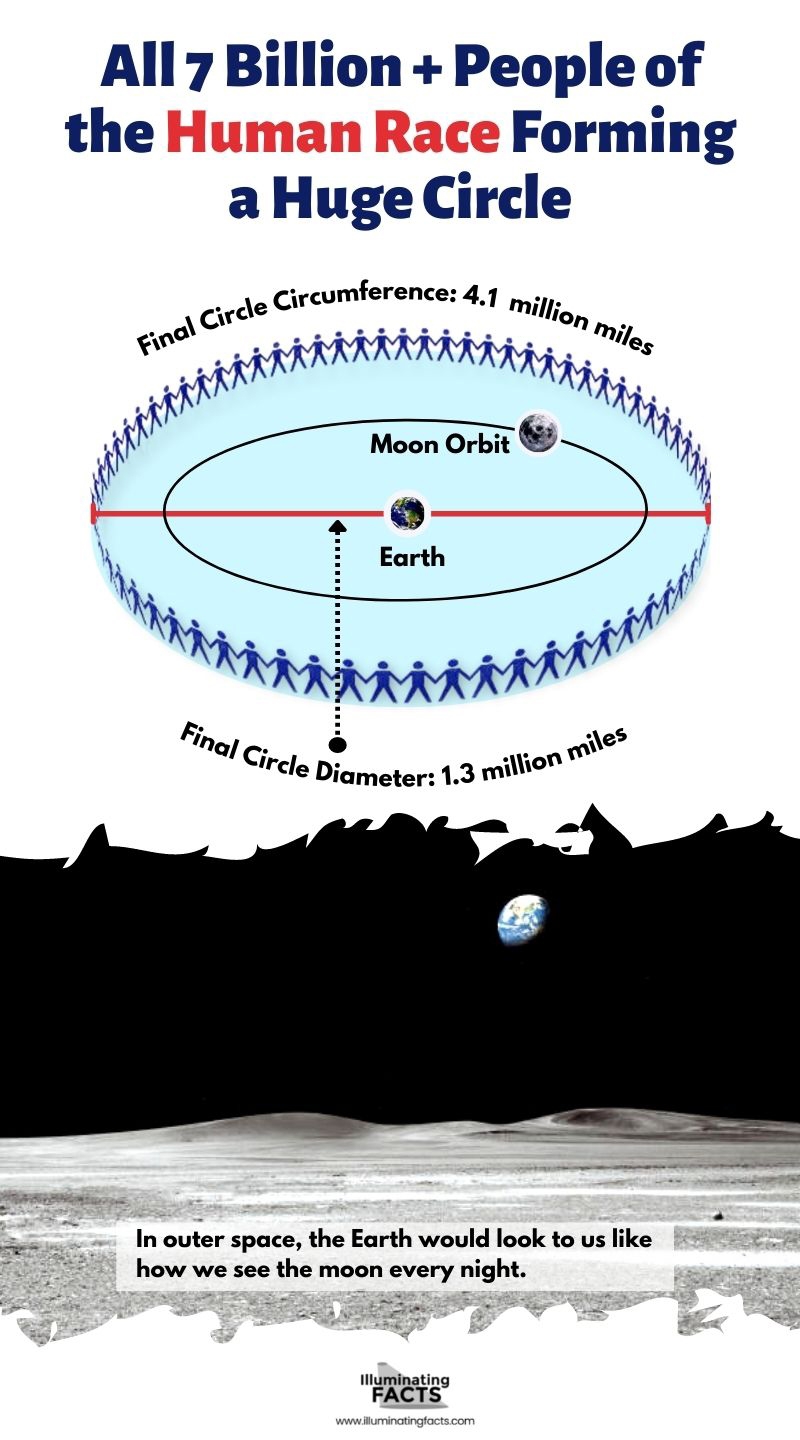
Can you imagine all of the people on Earth holding hands and forming a huge circle? For instance, let’s say that all of us stand side-by-side, holding hands, which is enough distance to take up around 3 feet of the circle each.
When all the people in the world do this, the final circle will have a circumference of about 4.1 million miles and a diameter of 1.3 million miles. When we are put into outer space that way, the Earth will look to us about the same size as how the moon usually looks in our night sky. [3]
Fitting All People in One Place
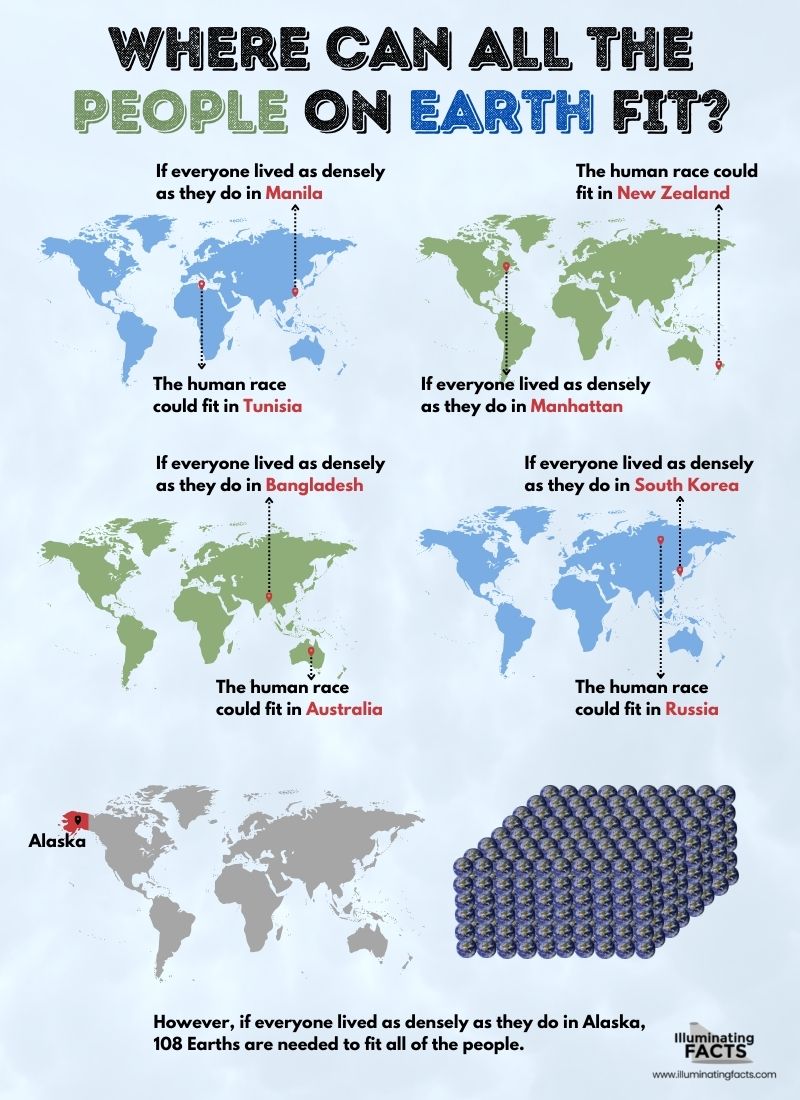
Based on some research, it is possible to fit all of the people on Earth in one place. Do you think that can be done? Well, if you think about it, if we all live at the density that people live in certain places, then there can indeed be areas in the world where the entire global population could fit. Take a look at the example below:
When you try to rethink population density and space, it can be possible for all of the human race to fit in one place. For instance, if all of us lived at the density of people in Manhattan, the whole global population would be able to fit in New Zealand. Also, space is not the main issue. The point is that when we talk about all the issues with the growing population, what’s scary is not the space for each of us but the resources and their distribution. [4]
When you want to arrange people in two dimensions to fit them in one place, the first thing you need to think about is how much ground area each needs when bunching them all together as close as possible without killing everyone. The answer to this question is 10.76 square feet. Therefore, 10 people can fit in a square foot.
At 10 people per square foot, 1,000 people can fit in a 32.8. x 32.8 square feet. If a basketball court is 301 x 161 square feet, then 4,200 people can fit in it all in bounds. An American football field can hold 54,000 people, which is big enough to fit all the people in Monaco. If the space is expanded into a soccer field or a football pitch, then more than 71,000 people can fit in it, which is more than enough space to cover the population of Greenland. [3]
The size of Tiananmen Square in China is 9,472 x 5,381 square feet. If it is empty, about 4.4 million people can fit in it, or the entire population of Lithuania, Oman, or Lebanon. [3]
All the World’s Population in New York City
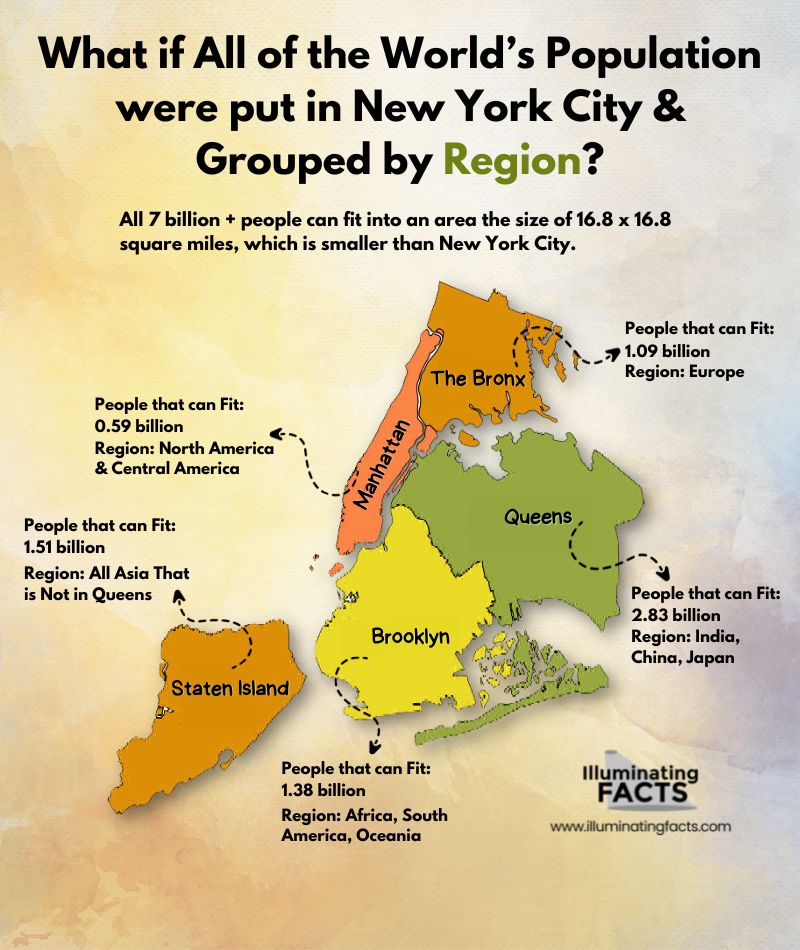
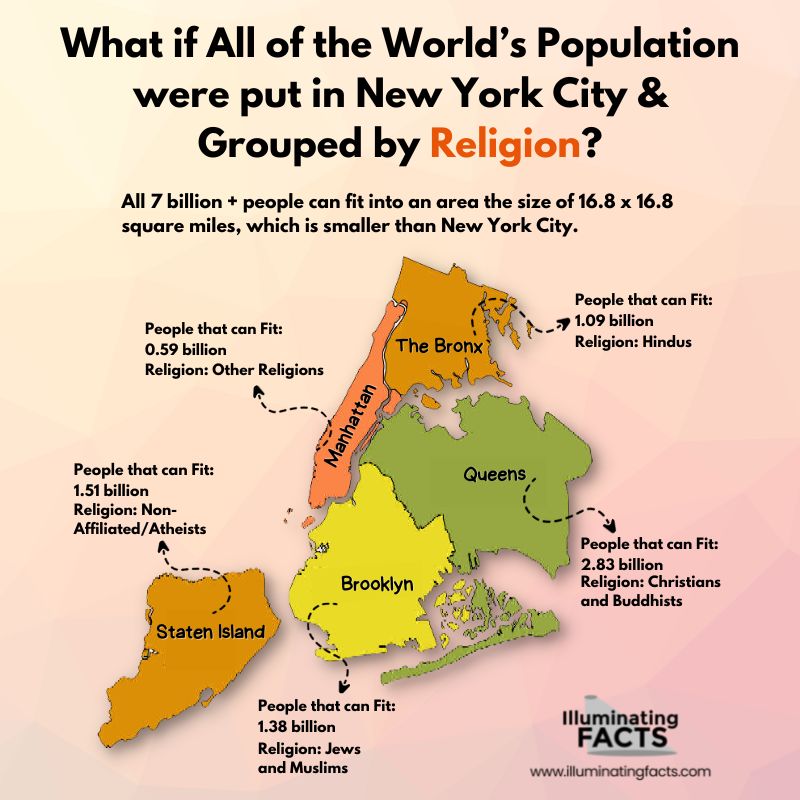
Central Park has an area of 1.3 square miles. It could easily hold the population of Peru, Venezuela, Malaysia, Nepal, or Saudi Arabia. But what we need to know is the size of land that is needed to hold all the 7 billion something of us. The answer to that is 16.8 x 16.8 square miles, which is smaller than New York City.
The area of New York is 303 square miles. This means that the whole human race will be able to fit inside it, with space for another half a billion people. That is how much ground space all living humans on Earth may take up. [3]
The People on Earth by the Numbers
As of July 2020, there are about 7.8 billion people in the world. However, this is only an estimate of the total number of people living on this planet and not a true running total of every baby born minus every person who has died at a given moment in time. It is impossible to keep track of the real-time numbers of the world population. It is estimated by demographers and statisticians through calculations. They add up estimates of regional populations from the United Nations. The population of people on our planet can be categorized in many ways. It can be viewed by age group, religion, and more.
World Population by Age Group
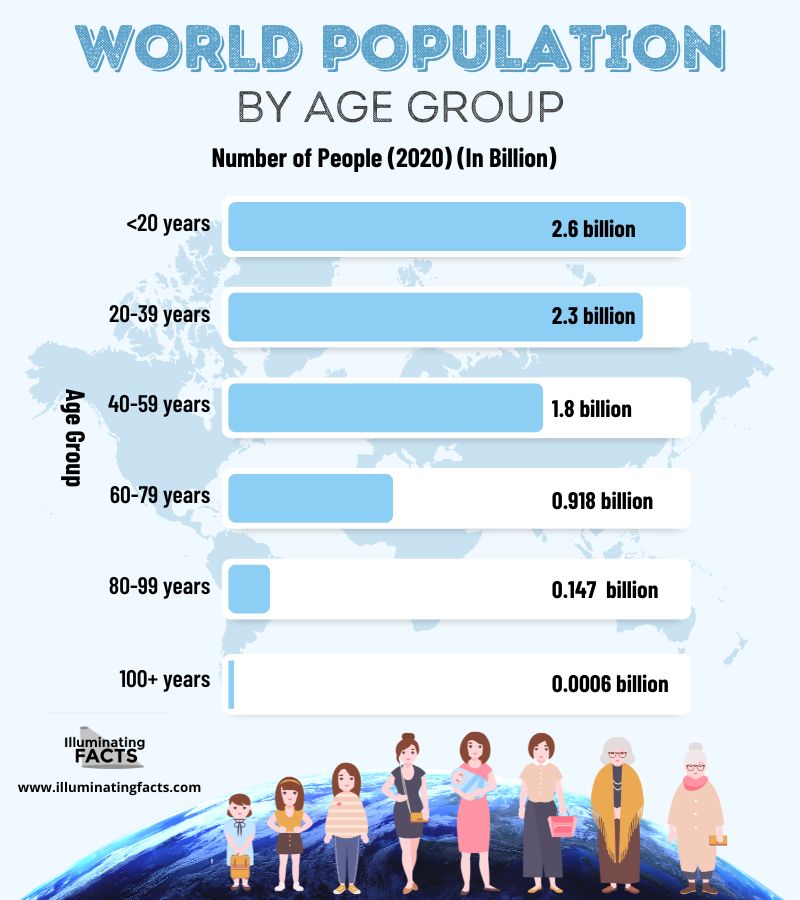
The global population on our planet is getting older, mostly due to the increasing life experience and declining birth rates. Take a look at the graph below:
Back in 2020, over 147 million people around the world were between the ages of 80 to 99, accounting for 1.9% of the global population. While that may seem small, it accounted for about 0.05% of the population in 1950. This means that our world has a particularly higher percentage of older people now than it did 70 years ago. [5]
This is essential to know because an aging population means a decreasing labor force and a growth of people looking to cash in their pensions, which could put pressure on the working class if taxes are increased. But an aging population also has positive impacts on society. For example, based on research, there are lower crime rates in older communities.
World Population by Religion
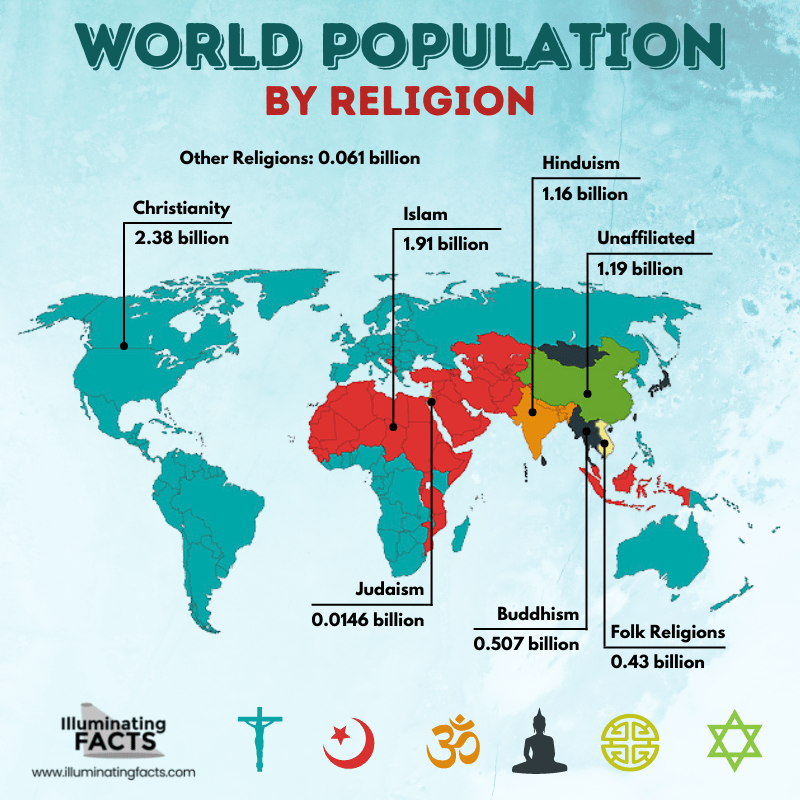
About 85% of the people in the world identify with a religion. Christianity is the most popular religion which is followed by an estimated 2.38 billion people worldwide. Next to it is Islam, which is practiced by over 1.91 billion people. But based on population researchers, by 2050, Islam will have nearly caught up to Christianity. Take a look at the infographic below to learn about the world population by religion.
The other religions measured and projected include Judaism, Buddhism, and two umbrella categories. One is folk religions, which include Chinese folk religions, traditional African religions, and both Native American and Australian aboriginal religions. The “other religions” category includes smaller faiths, including Taoism, Jainism, Shintoism, and Sikhism. There were also a significant number of people that remained nonreligious or had Atheist beliefs. [6]
World Population by Continent
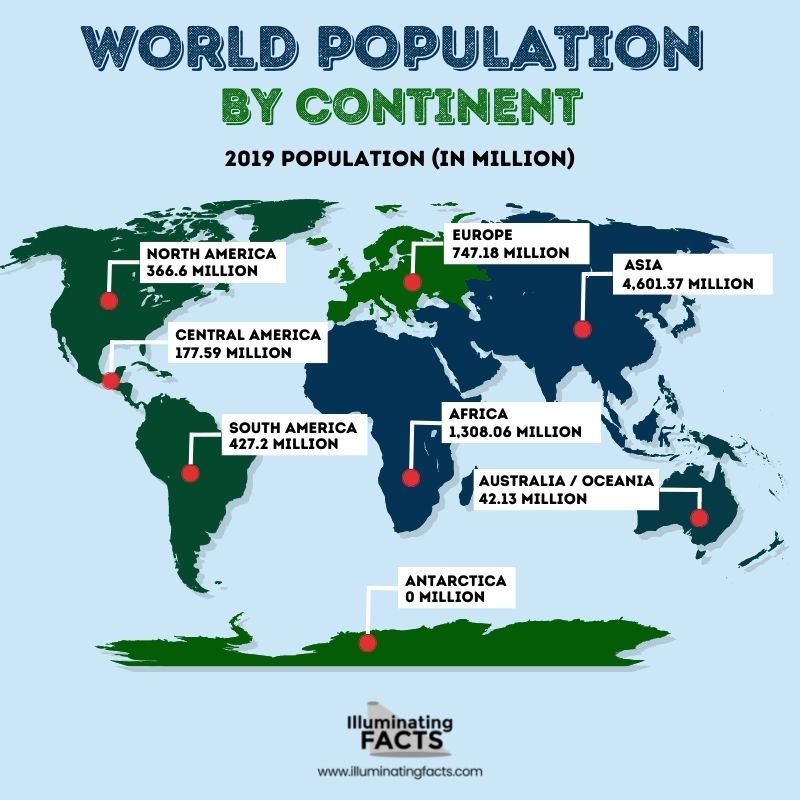
The infographic below shows the population of the world in 2019 by continent:
The most populous continent in the world is Asia, with 4.6 billion in 2019. It is expected to have the highest number of people living in urban areas in 2050. Asia has two of the most populous countries in the world, which are China and India. Both of these countries have more than a billion people. [7]
These are just a few ways how the population of the world can be viewed. You can also read our post titled Deep Dive into the Growth of World Population for more in-depth information about the population of the world that we live in.
More Interesting Statistics About Population / People on Earth
Below are more interesting statistics about the population/people on Earth that you should know about:
- The world population is rapidly increasing. Did you know that the population of our world increases by about 83 million people each year? If populations continue to rise as they are now, there will be about 10 billion people on Earth by 2050.
- Among the ten most populous countries in the world, Nigeria has the fastest-growing population. It has a growth rate of 2.6% each year. By 2050, it is estimated to have 410 million, which is more than double from 195 million.
- Out of the world’s population, 50.4% are male, and 49.6% are female.
- From 2017 to 2050, it is projected that half of the population growth of the world will be concentrated in just nine countries, which are Nigeria, India, Ethiopia, Pakistan, the Democratic Republic of Congo, the United States of America, the United Republic of Tanzania, Indonesia, and Uganda.
- China and India are still the two most populous countries in the world, which represent 19 and 18 percent of the population of the world, respectively. In 2024, these countries are expected to have about 1.44 billion people.
- About 27% of the world’s population are millennials. These are people born between 1981 and 1997. In fact, around 2 billion people are part of this generation. Also, around 71% of millennials live in Asia or sub-Saharan Africa.
- More than 108 billion people have lived on Earth. This means that the more than 7 billion currently on the planet represent just 7%. Out of the 108 billion people on Earth, only 7% are presently alive.
- There are around 80 million births in the world each year. This means that there is an addition of around 80 million people as New Year starts.
- There are 3,000 births every 20 minutes and a succeeding loss of 27,000 species of animals and plants. This is because the growth in population translates to the abuse of flora and fauna in people’s lives.
- More than 50% of the world’s population is under 30 years. This translates to around 3.8 billion people between 0 to 30 years of age.
Conclusion
Visualizing all of the people on Earth at once is indeed challenging. Based on computations done by researchers, we can see the possibility of this. However, none of us know if it is possible to really fit all of the people in the world in one place. The Earth’s people and population are among the most interesting topics to learn about. But remember that the numbers we’ve given here are just estimates based on the data given by the United Nations. We hope this post helped you learn more about visualizing the population/people on Earth.
References
[1] Blackburn-Dwyer, B. (2016, July 11). 10 charts that show how the world’s population is exploding. Global Citizen. Retrieved July 18, 2022, from https://www.globalcitizen.org/en/content/world-population-charts-today-future/
[2] Bostock, B. (2019, July 11). These 12 amazing graphics show how populations have changed around the world. Insider. Retrieved July 18, 2022, from https://www.insider.com/graphics-showing-population-change-world-2019-7#1-this-interactive-graph-shows-just-how-much-the-worlds-population-accelerated-after-1900-1
[3] Urban, T. (2017, February 23). 7.3 billion people, one building. Wait But Why. Retrieved July 18, 2022, from https://waitbutwhy.com/2015/03/7-3-billion-people-one-building.html
[4] Brownstone, S. (2014, November 10). Think the world is crowded? you could fit the entire human race in New Zealand. Fast Company. Retrieved July 18, 2022, from https://www.fastcompany.com/3016331/think-the-world-is-crowded-you-could-fit-the-entire-human-race-in-new-zealand
[5] Ang, C. (2021, June 17). Visualizing the world’s population by age group. Visual Capitalist. Retrieved July 18, 2022, from https://www.visualcapitalist.com/the-worlds-population-2020-by-age/
[6] World Population Review, E. (2020). Religion by Country 2022. Religion by country 2022. Retrieved July 18, 2022, from https://worldpopulationreview.com/country-rankings/religion-by-country
[7] Szmigiera, M. (2022, June 22). Forecast: World population, by continent 2100. Statista. Retrieved July 18, 2022, from https://www.statista.com/statistics/272789/world-population-by-continent/
[8] Edwards, S. (2020). 10 things you didn’t know about the world’s population – office of the secretary-general’s envoy on youth. United Nations. Retrieved July 18, 2022, from https://www.un.org/youthenvoy/2015/04/10-things-didnt-know-worlds-population/
[9] Alexander, S. (2021, December 9). Dyk these 10 surprising World Population Facts? ONE. Retrieved July 18, 2022, from https://www.one.org/us/blog/10-surprising-population-facts/

