Fast Food is one of the most consumed forms of food all over the world. The developed countries such as the USA and UK have a higher trend of consuming fast food compared to the lesser developed countries. During the mid-1990s and 2000s, several fast-food chains opened up, many of which have emerged as billion-dollar companies today. This includes McDonald’s, KFC, Burger King, Pizza Hut, and many others as well. The global fast-food industry is growing massively and we can evaluate that with the help of the following graphs.
Find Out More…
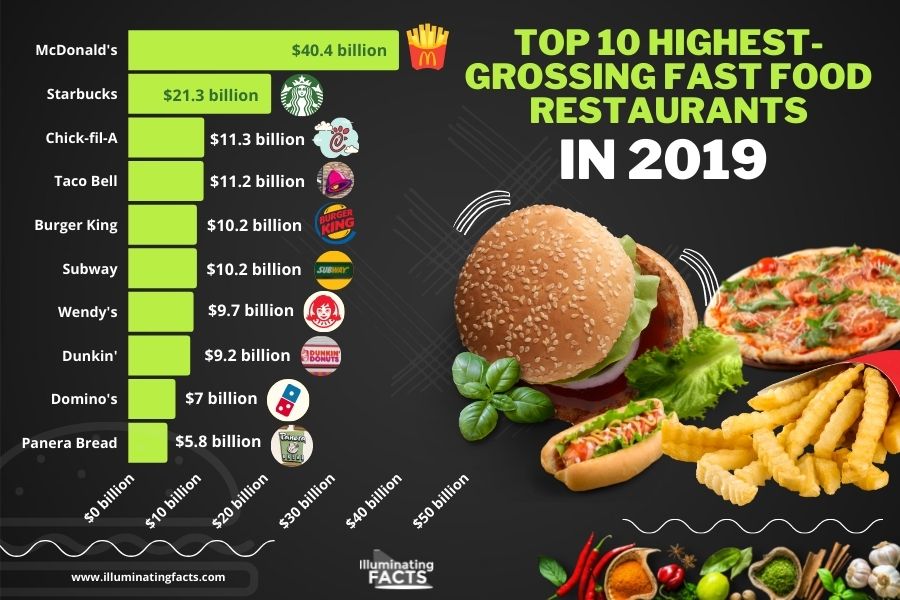
Top 10 Highest Grossing Fast Food Restaurants in 2019
As of 2019, the global fast-food industry was more than $647 billion which is well-diversified among multiple national and international food chains. On top of this list is McDonald’s which had $40.41 billion in turnover in 2019. Starbucks came on the second spot with $21.55 billion in sales. Chick-fil-A and Taco Bell had the same revenue of $11 billion each. Burger King is on the fifth spot as it had $10.3 billion in yearly turnover during 2019 followed by Subway having $10 billion revenue. Other companies in this list include Wendy’s, Dunkin’s, Domino’s, and Panera Bread.
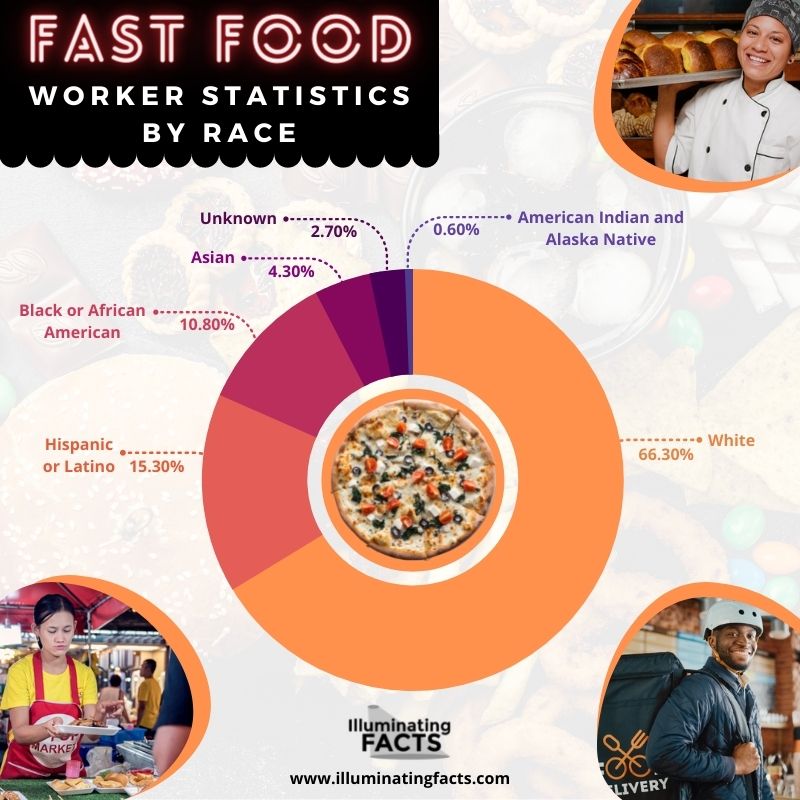
Fast Food Worker Statistics By Race
The fast-food industry does not have any kind of racial profiling usually. However, an overall trend suggests that Whites are more involved in the fast-food industry compared to other races. According to the graph, 66.3% of fast-food workers are Whites while 15.3% are either Latinos or Hispanics. These two groups account for most of the fast-food workers. About 10.8% of the workers in the fast-food industry are Asians while the remaining belongs to other races.


