The world is full of amazing delicacies, particularly sweets. No matter if it’s juice, dessert, or anything else, the need for sugar is essential in many industries of the world. This is why sugar is produced at a mass scale. Although many argue that processed sugar is somewhat harmful to us, it still possesses a high demand which is evident from big numbers of the sugar industry globally.
Find Out More…
Top Sugar Producing Countries
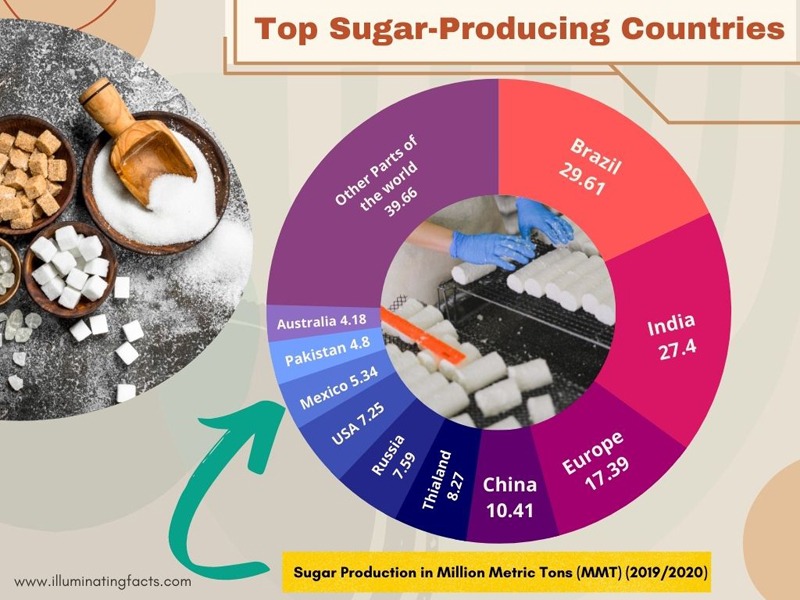
Processed sugar is made out of sugarcane, a crop grown in many countries. This graph shows how the global sugar production market is spreading and which countries are the top producers of sugarcane. Although the need for sugar is present globally, it is quite odd that there are few large players only. From the graph, it can be seen that the top 3 producers of sugar globally are Brazil (29.61 Metric Tons), India (27.4 Metric Tons), Europe (17.39 Metric Tons), China (10.41 Metric Tons), and Thailand (8.27 Metric Tons). Russia, USA, Mexico, Pakistan, and Australia are the subsequent sugar-producing countries. The rest of the world produces 39.66 Metric Tons of sugar.
Top Sugar Consuming Countries
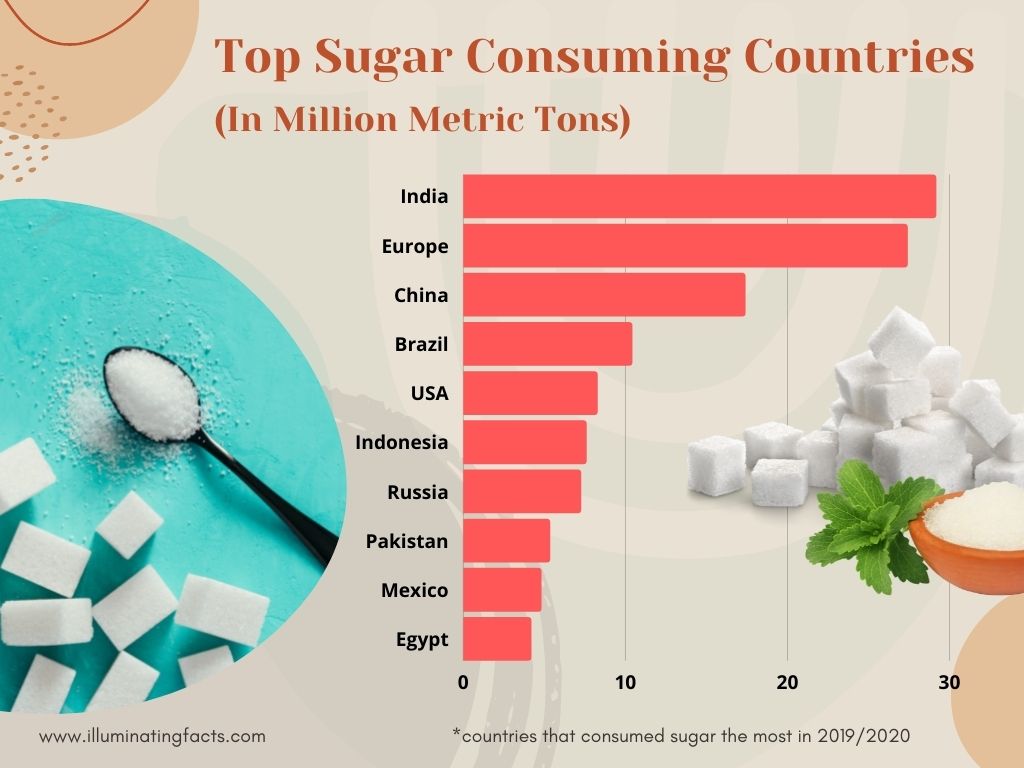
One of the most important quantitative factors in the sugar industry is the production vs consumption aspect. We have seen in the first graph that Brazil produces the most sugar in the world as a country but in terms of consumption, it is far behind as much of it is exported to countries having higher population and an ultimately higher demand for sugar.
This graph summarizes the top sugar-consuming countries as of 2018/2019 where the total sugar consumption was 172.6 Million Metric Tons. The top 5 sugar-consuming countries include India, Europe, China, Brazil, and the USA. The next five countries include Indonesia, Russia, Pakistan, Mexico, and Egypt respectively.
Average Individual Sugar Consumption by Country
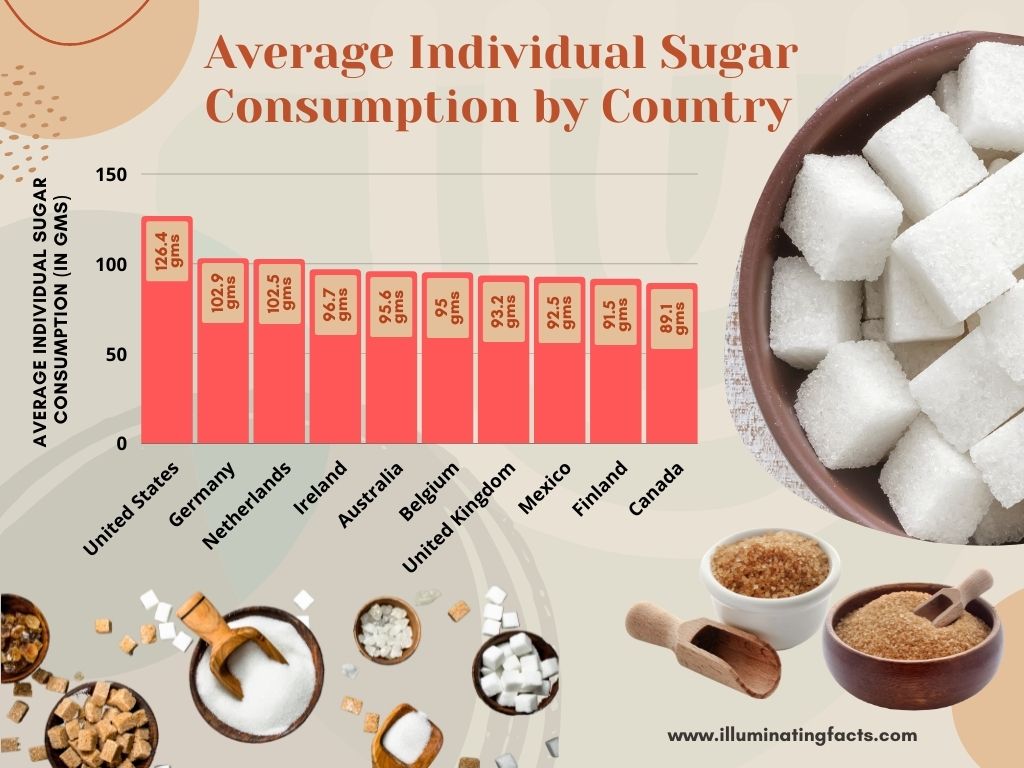
After evaluating the aggregate production and consumption of sugar, the following graph summarizes the individual aspect of sugar consumption country-wise. The higher is the per person sugar consumption, the more would be the chances that this country has diabetic patients and other medical issues regarding sugar.
From the graph, it is evident that the average individual consumption of sugar is highest in the USA, which is about 126.4 grams. Other countries that follow include Germany (102.9 grams), the Netherlands (102.5 grams), Ireland (96.7 grams), Australia (95.6 grams), and Belgium (95 grams). UK, Mexico, Finland, and Canada are the subsequent countries in this list, respectively.
Where Does Most Sugar in Our Diet Come From?
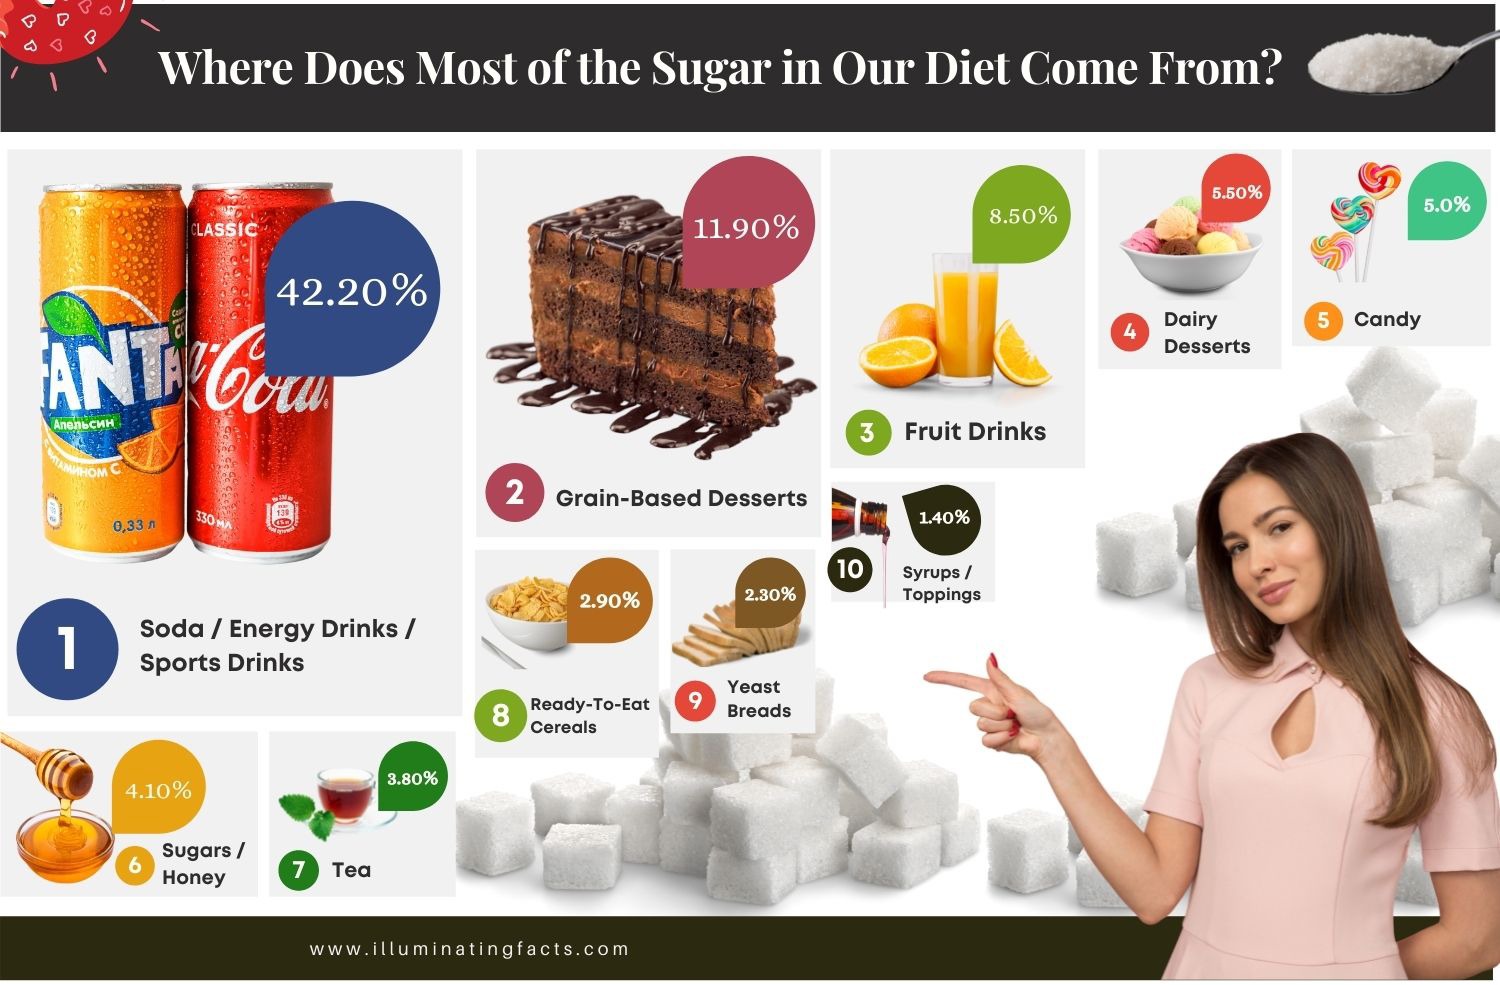
This next infographic is indeed a unique illustration of the sources from which we mostly consume our sugar. Surprisingly, most of them are highly unhealthy sources which make it a major source of concern to consume sugar. As per detailed research and this infographic, about 42.2% of sugar comes from carbonated beverages. Most of us consume these drinks without even knowing that they carry high content of sugar.
Other sources of sugar include Grain-based desserts (11.9%), Fruit Drinks (8.5%), Dairy Desserts (5.5%), Candy (5%), Honey / Sugars (4.1%), and Tea (3.8%).
Percentage of Sugar Each Food Contains
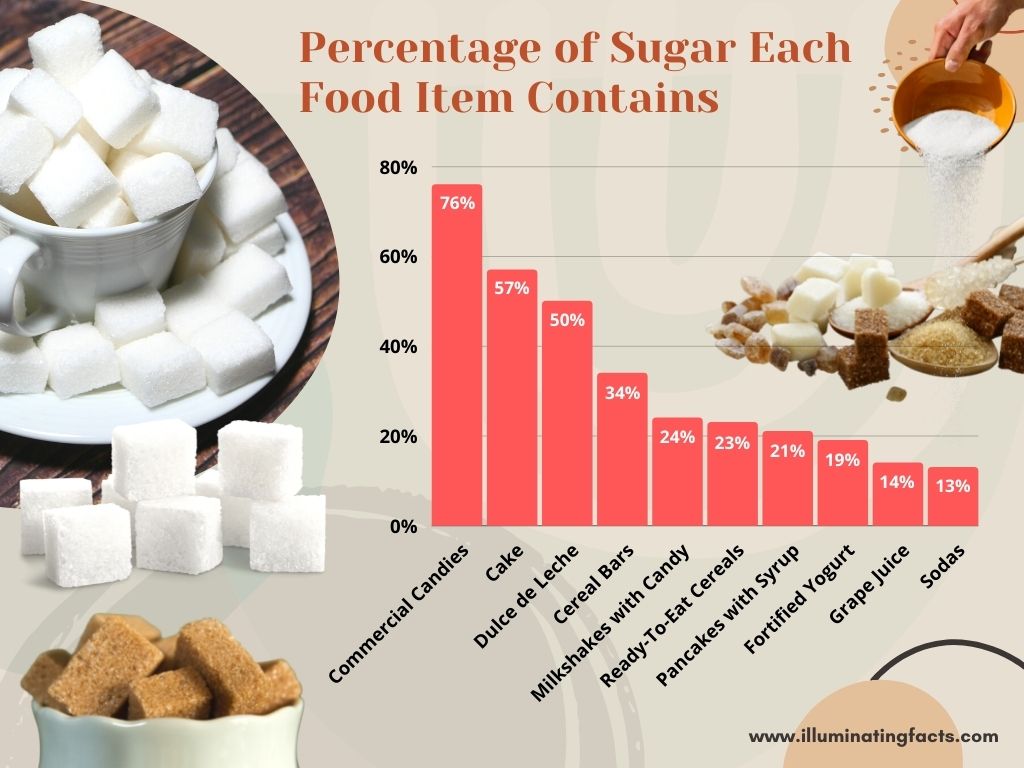
This graph summarizes the percentage of sugary content out of the total content of a particular consumable product. On top of this list, we have commercial candies which contain about 76% sugar. Such a high number yet parents get their children the candies so that they can have a temporary enjoyment at the cost of their health. Other items in this list include Cake (57%), Dulce de Leche (50%), Cereal Bars (34%), Milkshakes with Candy (24%), and Ready-to-Eat Cereals (23%). Some other sources containing a fair amount of sugar include Pancakes with Syrup, Fortified Yoghurt, Grape Juice, and Sodas.

