Tea is an all-time favorite drink for many and is one of the biggest competitors of coffee as well. Tea is consumed in several parts of the world and there are unique tastes everywhere. With so many varieties and brands of tea, the tea market has grown extensively over the past few years. Flavored teas are also getting attention from the youth which is why the tea market has become quite diverse. In terms of numbers, we can evaluate how big the entire tea industry is.
Find Out More…
Global Tea Market Value
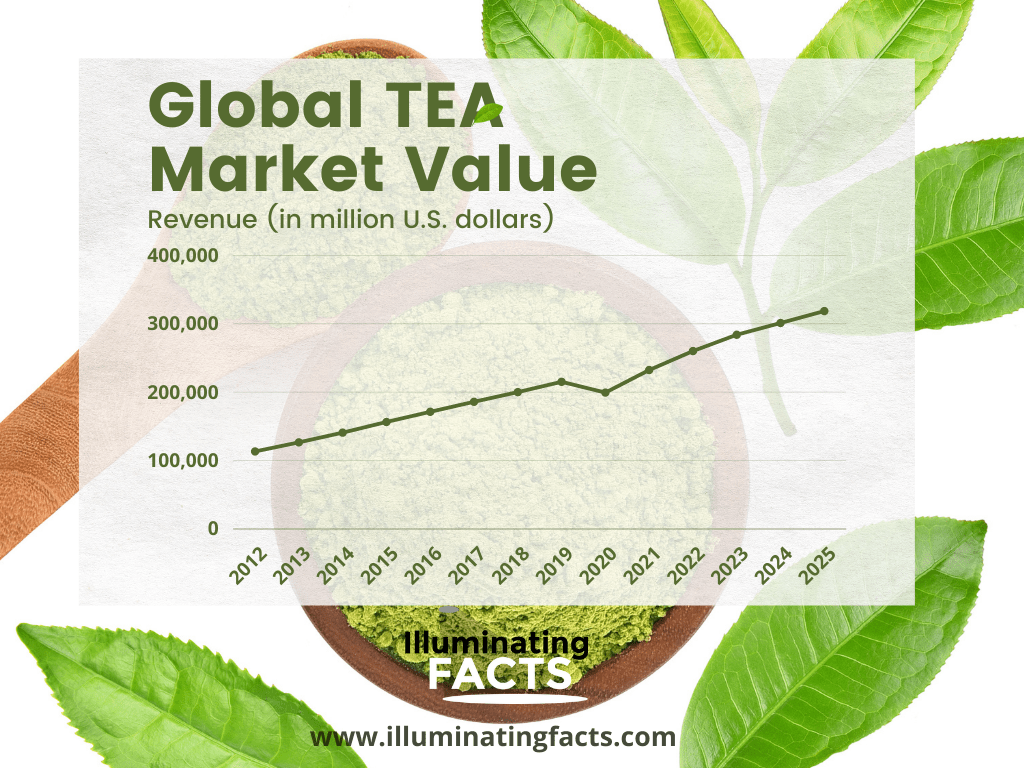
The global tea market value has seen a sharp and consistent rise over a period of 12 years between 2012 and 2024. As of 2012, it was around $100,000 million in terms of revenue generated from the global tea market. It reached the double value of $200,000 million by 2019 after which a small fall was noticed mainly because of the COVID-19 pandemic. Forecasts predict that the global tea market value is expected to reach 3 times the actual value of 2012. It would cross $300,000 million in terms of revenue generated because of tea.
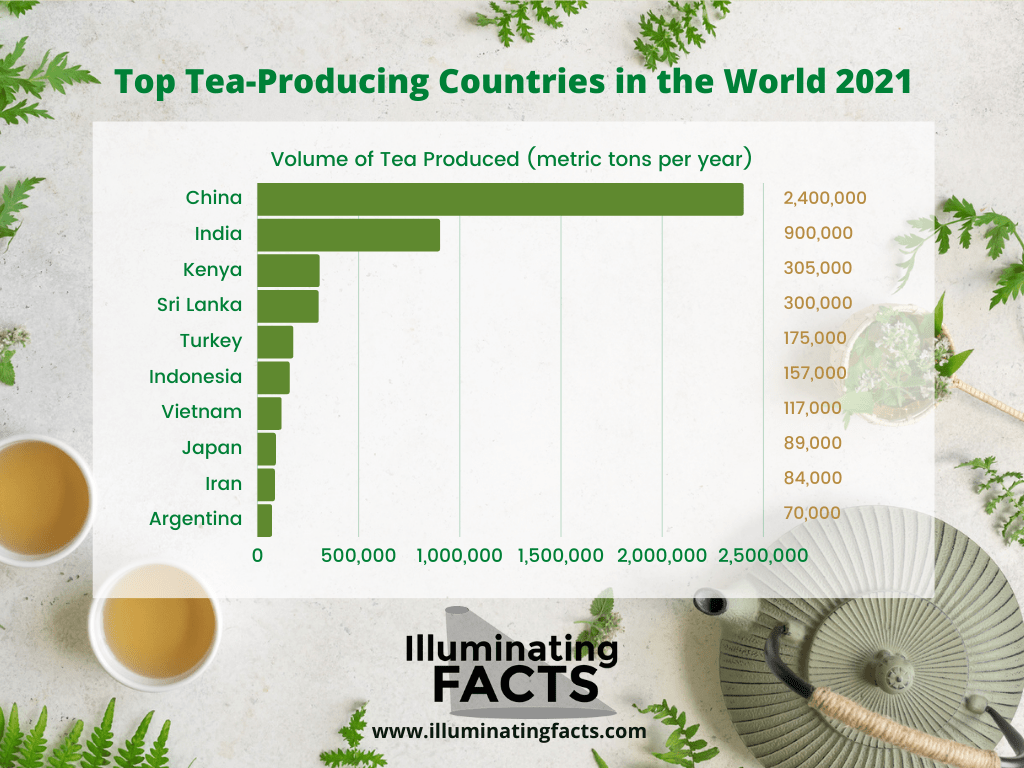
Top Tea-Producing Countries in the World as of 2021
Tea has a massive market all over the world which is why many countries are indulged in the production of tea as well. However, the industry is dominated by a few top market players only while the rest produce it on a small scale. The top 4 large-scale players include China, India, Kenya, and Sri Lanka. China has the most market share as it produces 2,400,000 metric tons of tea every year. India, Kenya, and Srilanka have a combined production of about 910,000 metric tons with an average of 300,000 metric tons per country. Other countries in this list include Turkey, Indonesia, Vietnam, Japan, Iran, and Argentina.
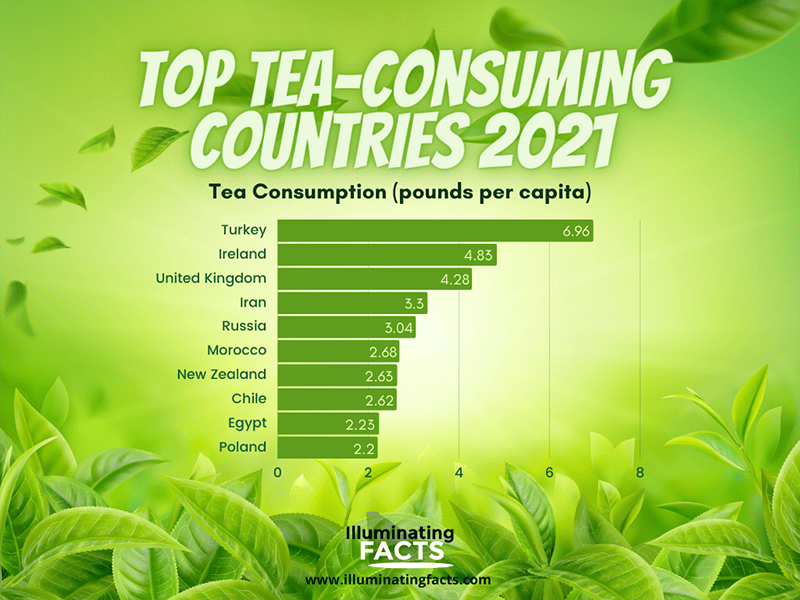
Top Tea Consuming Countries in the World as of 2021
Although China is the biggest producer of tea, it is not the biggest consumer of tea. As a matter of fact, it exports it to other countries where the trend of tea is high. On top of tea-consuming countries stands Turkey with a consumption of 6.96 Pounds per capita. This is followed by Ireland (4.83 Pounds per capita), and the United Kingdom (4.28 Pounds per Capita). Iran and Russia have 3.3 and 3.04 pounds per capita consumption of tea respectively. Other countries such as Morocco, New Zealand, Chile, Egypt, and Poland have less than 2 pounds per capita of tea consumption.
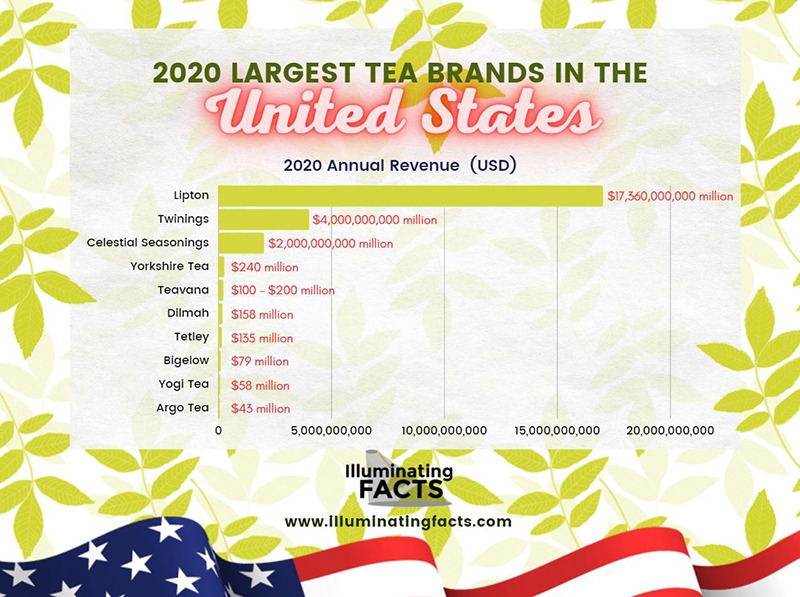
Largest Tea Brands in the USA in 2020
This next graph shows us the level of intense competition which exists in the United States in the tea market. While the market is dominated by 3 large players, the small-scale and medium-scale players are also getting their revenues increased year by year and capturing a higher market share. Lipton is the largest tea brand with revenue of $17,360 million followed by Twinings at $4000 million and Celestial Seasonings at $2000 million. The other companies have a limited revenue of less than $250 million which includes Yorkshire Tea, Teavana, Dilmah, Tetley, Bigelow, Yogi Tea, and Argo Tea.

