Transportation is a fundamental aspect of our lives. Even before automobiles, humans traveled long distances for personal and business purposes.
The invention of automobiles helped expand human horizons, including new prospects of global trade, close personal connections, and ease of health, school, and vocational services. The automobile industry has come a long way since its beginning, which is why we cannot fathom our lives without them these days.
Following are some interesting graphs and charts enlightening us about the various aspects of the automobile industry:
Find Out More…
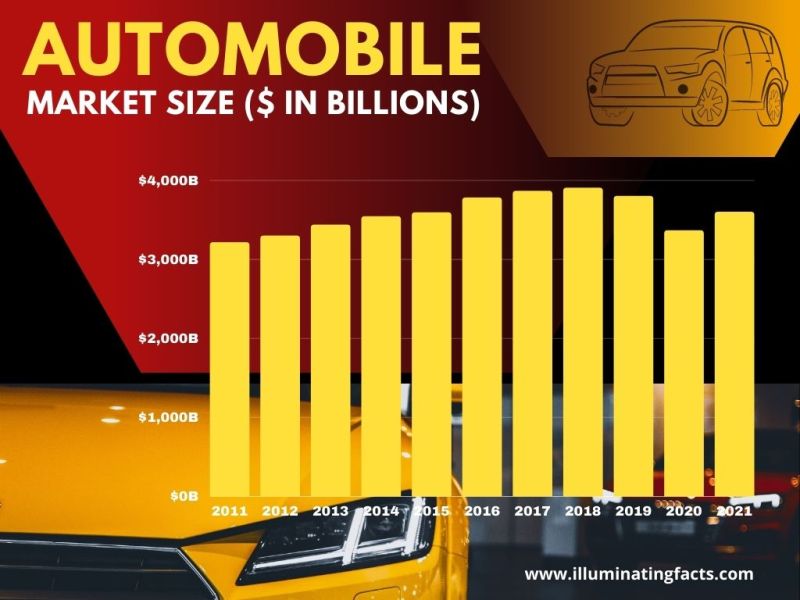
Automobile Market Size (in billion dollars) from 2011 to 2021
The global automobile market size as gauged by billion dollars in 2011 was about $3,200 billion. As the graph shows, the market size of the automobile industry kept growing consistently from 2011 to 2015, reaching about $3,500 billion.
From 2016 to 2018, the automobile industry hit a record-time high and almost reached $4,000 billion. However, the market size of the automobile industry suffered a downfall which continued for a year (till 2020), falling as low as $3,100 billion. Lastly, 2021 shows a significant rise in the market size of automobile industry as its revenue regained its $3,500 billion mark.
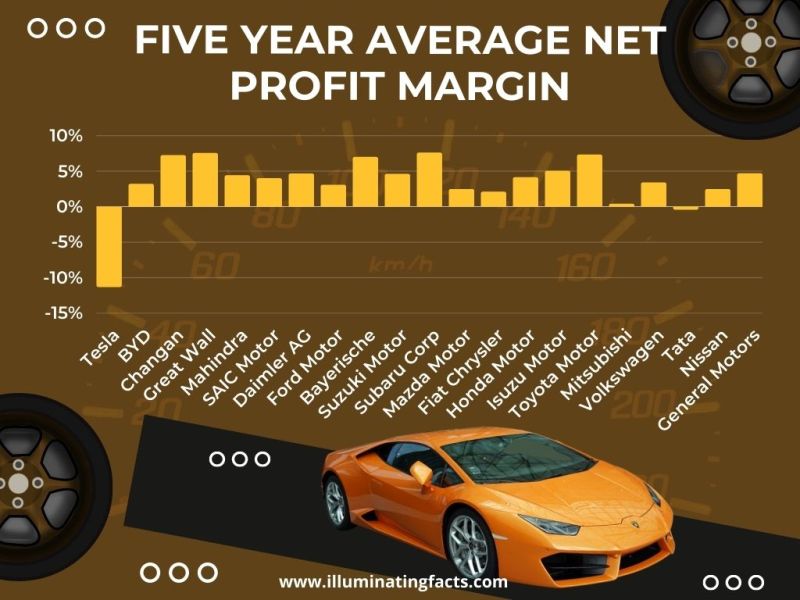
Five Year Average Net Profit Margin of the Various Automobile Brands
This graph shows the percentages of net profit margins of various automobile brands in a five-year time window as per figures collected in 2020. Only Tesla shows a negative average net profit margin of about 10% among all the manufacturers.
On the other hand, the automobile manufacturers yielding the highest average net profit margins are Changan, Great Wall Motor, Bayerische, Subaru Corp, and Toyota Motor.
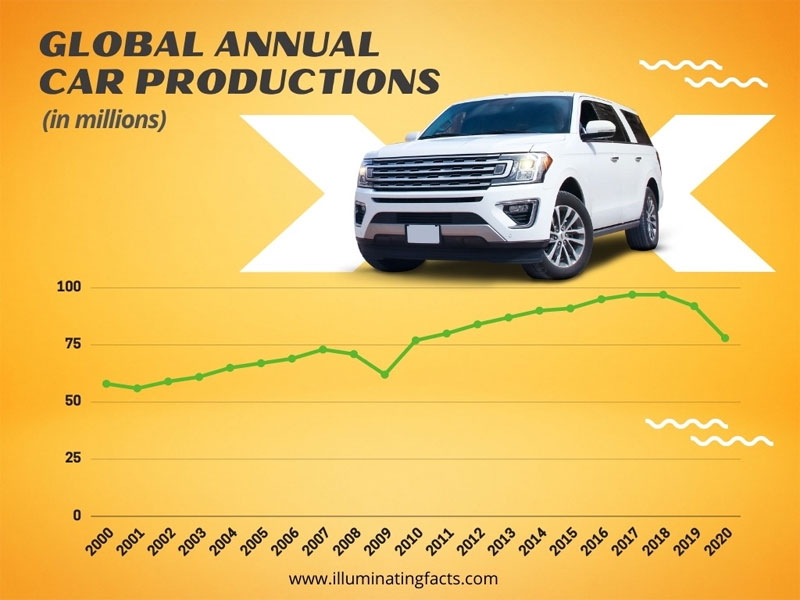
Global Annual Car Productions (in millions)
This chart depicts the fluctuations in the global annual car productions (in millions) from 2000 to 2020. A steady increase in the international yearly car productions is visible from 2020 to 2008. However, 2009 witnessed a drop in the annual car productions worldwide as the figures dropped to 55 million.
The industry picked up pace in 2010 as the annual car productions crossed the 75 million mark. Since then, the automobile industry has never declined global annual car production until 2020.
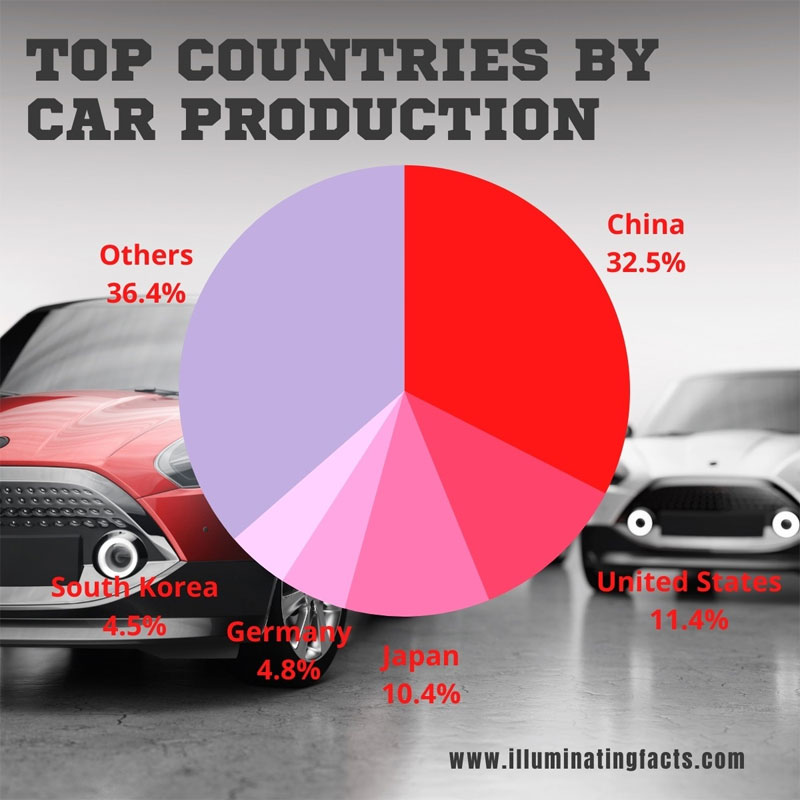
Top Countries by Car Productions
This pie chart depicts the leading car manufacturers across the globe. China has emerged as the top country that produces the most cars worldwide. It is followed by the USA and Japan, making up about 11.4% and 10.4 % of the world’s cars annually. Germany and South Korea are the two countries contributing to approximately 4.8% and 4.5%, respectively.
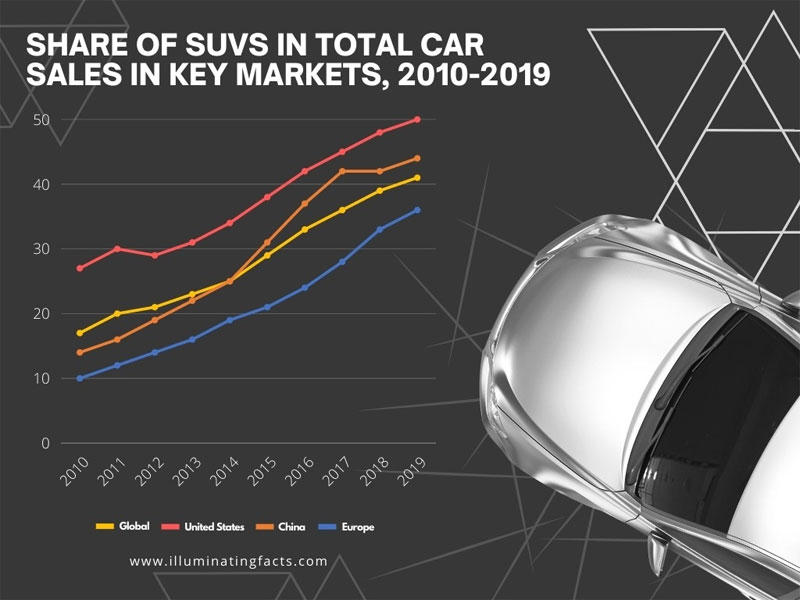
Share of SUVs in Worldwide Car Sales in Key Markets
The above graphical representation explains the standing of the SUVs in the global car sales in leading car markets, including the United States, China, and Europe. It depicts that the share of SUVs is the highest in the USA, where it has been on a steady increase since 2010.
In China, the share of SUVs in total car sales reached a record-high in 2019 only. Europe has the lowest car sales share to offer to the SUVs.
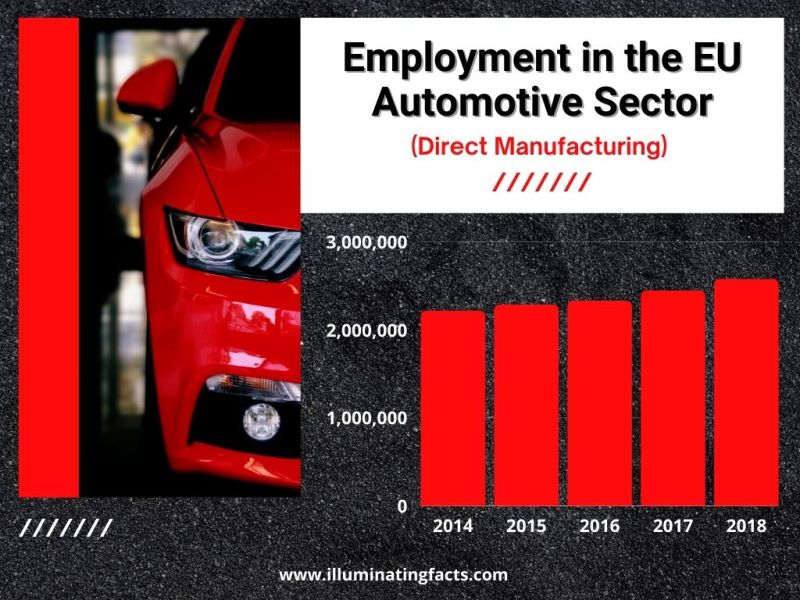
Employment in the EU Automotive Sector
The above bar chart represents the trend of EU employment in the automotive sector, as measured by direct manufacturing in the EU countries. In 2014, approximately 2,100,000 cars were being manufactured. In a short period of four years, between 2014 and 2018, employment in the EU automotive sector has bloomed.
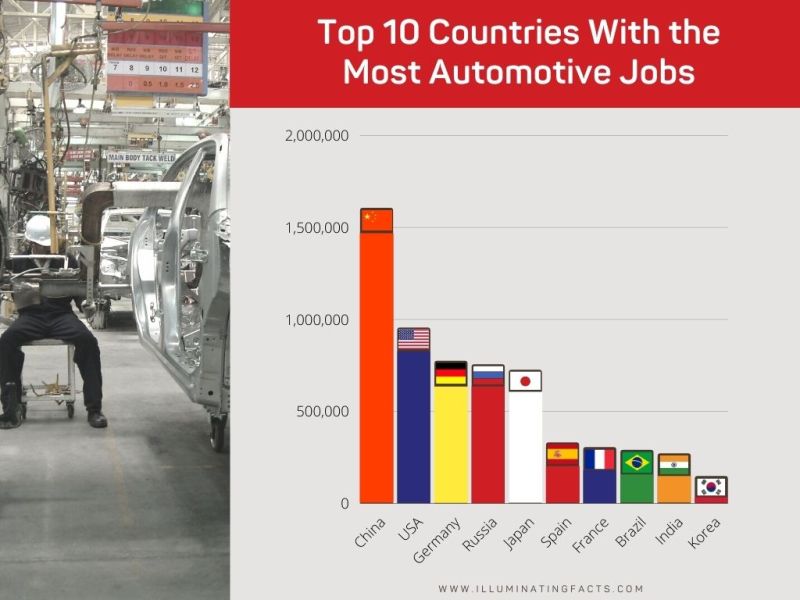
Top Ten Countries with the Most Automotive Jobs
This bar graph tells us about the ten leading countries that offer the most automotive jobs. According to the data, China ranks first in the list of countries with the most automotive jobs to offer. Other leading car-producing countries include the USA, Germany, Russia, and Japan (more than 500,000 jobs).
Spain, France, Brazil, and India offer less than 500,000 jobs, while Korea is the last among the ten leading countries offering automotive jobs.
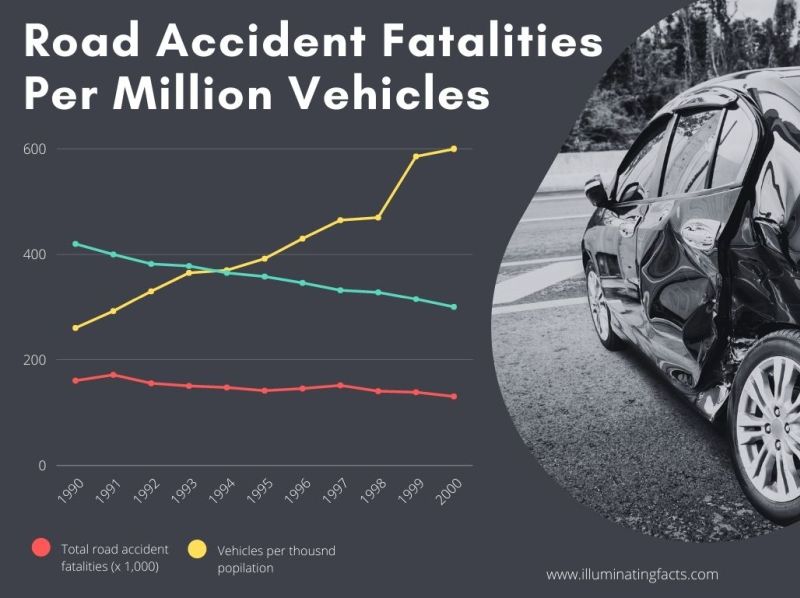
Road Accidents Fatalities per Million Vehicles
This chart depicts that fatalities in road accidents have decreased over eleven years (from 1990 to 2000). Compared to the statistics regarding vehicle production (per thousand population), the decreasing number of road accident fatalities highlights the advancement in car safety.
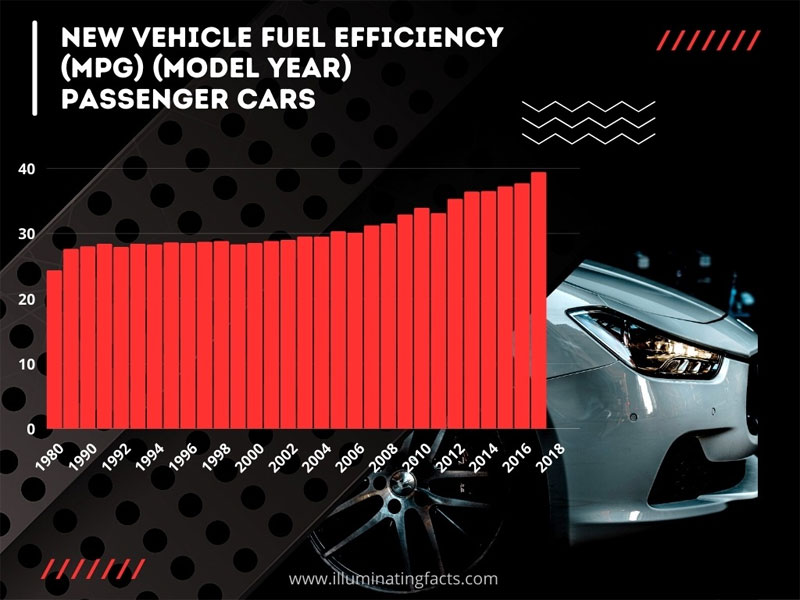
New Vehicle Fuel Efficiency (MPG) Passenger Cars According to the Model Years
Another significant concern regarding automotive production is fuel-efficient cars. The above graph shows how vehicles have become more fuel-efficient from 1980 to 2018. Thanks to the introduction of hybrid and electric cars, fuel efficiency is not a problem anymore in the latest hybrid/electric vehicles.
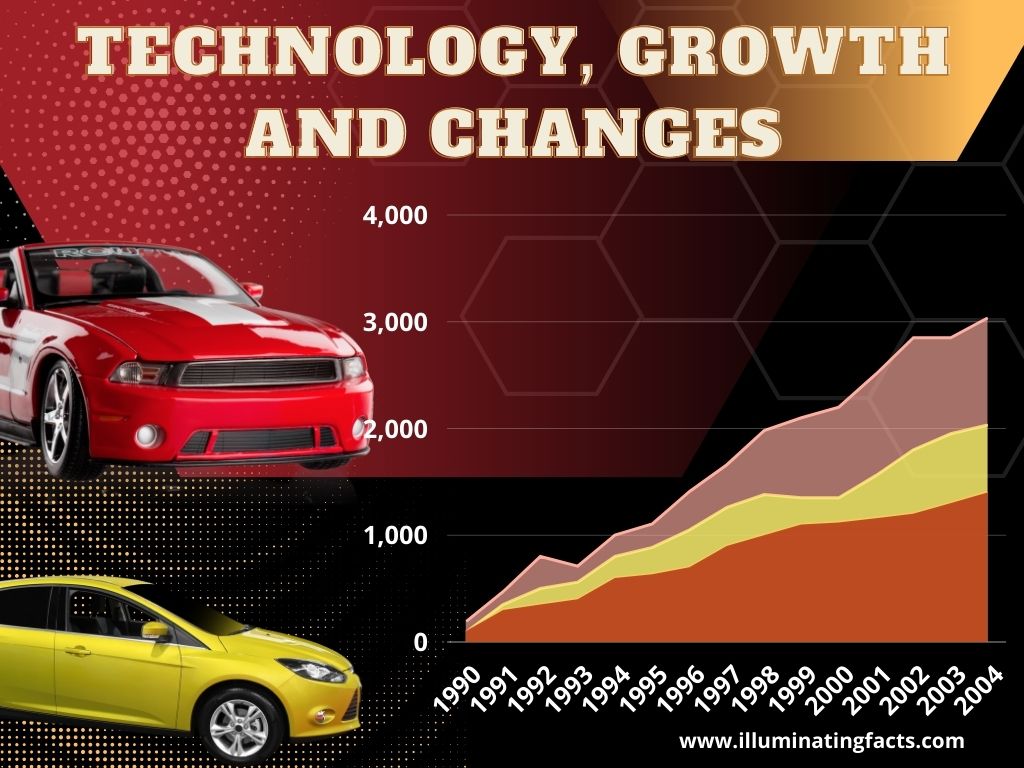
Technology, Growth, and Changes from 1990 to 2004
The above figures show a sharp increase in the technology of manufactured cars since 1990. Electronic and zero-emission vehicles have dominated the automotive industry in recent years.
Find out more about the interesting history in this infographic on the rise of the automobile industry.
Conclusion
Seeing how the automobile industry rose from the 90s till now is quite intriguing, and there’s a lot more to it than you might realize that we haven’t covered in these graphs and charts. Consequently, you should use it as a jumping-off point rather than the be-all and end-all when it comes to learning about the automobile industry.

