America is one of the most developed countries in the world with a population of 329.5 million. This huge population comprises several forms of households and residential arrangements. These unique social and economic arrangements shape the economy as well as lead the trend toward living in the future. The American Homes have emerged in various ways and we can study that more with help of the following graphs.
Find Out More…
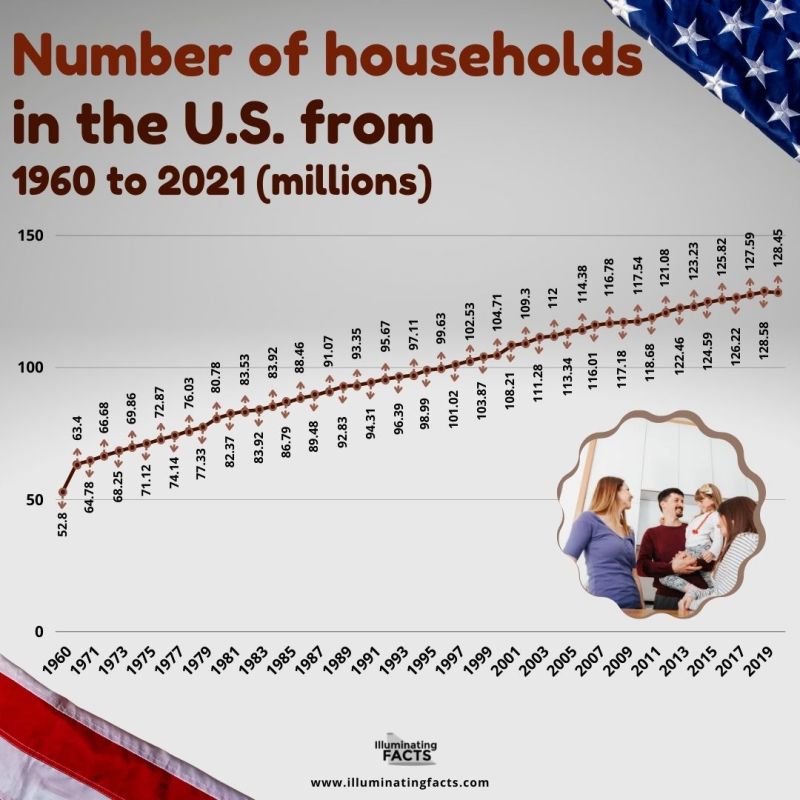
Number of Households in the USA from 1960 to 2021 (In Millions)
The USA has seen an increase in population over the past 50 years, a major one. For this reason, the number of households in the USA has also increased. In 1960, there were 52.8 million households all over the US. 11 years later, in 1971, this number crossed 63.4 million people. Since then, there has been a consistent and gradual increase. By 2001, there were 108.21 million households in the United States of America. In the next 20 years, this number rose by almost 20 million and reached 128.5 million households by 2021. This is more than a 120% increase from the households in 1960.
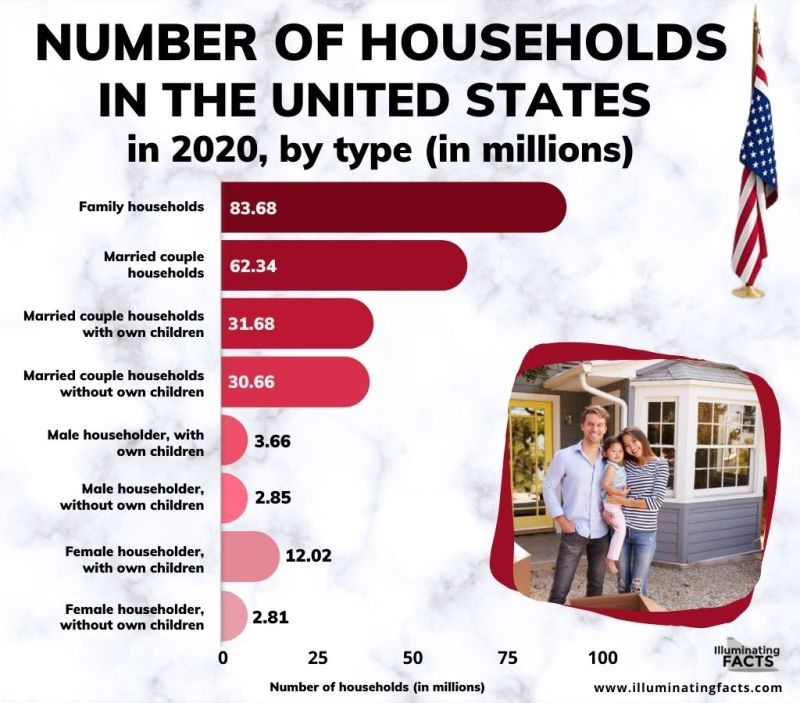
Number of Households in the USA in 2020, by type, (In Millions)
Households can be categorized among several types. People don’t only live together or only live alone. In modern times, several forms of households have emerged with emerging social trends and patterns. However, in the USA, family households are still the most popular ones. In 2020, there were 83.68 million family households in the USA followed by married couple households making up 62.34 million. Married households with their children are the third most popular type of household in the USA with 31.68 million households. With the increase in the trend of not having children, married couple households without children have also become popular with 30.66 million households. Single-parent households are relatively less popular. However, female householders with their own children still make up more than 12.02 million households in the US.
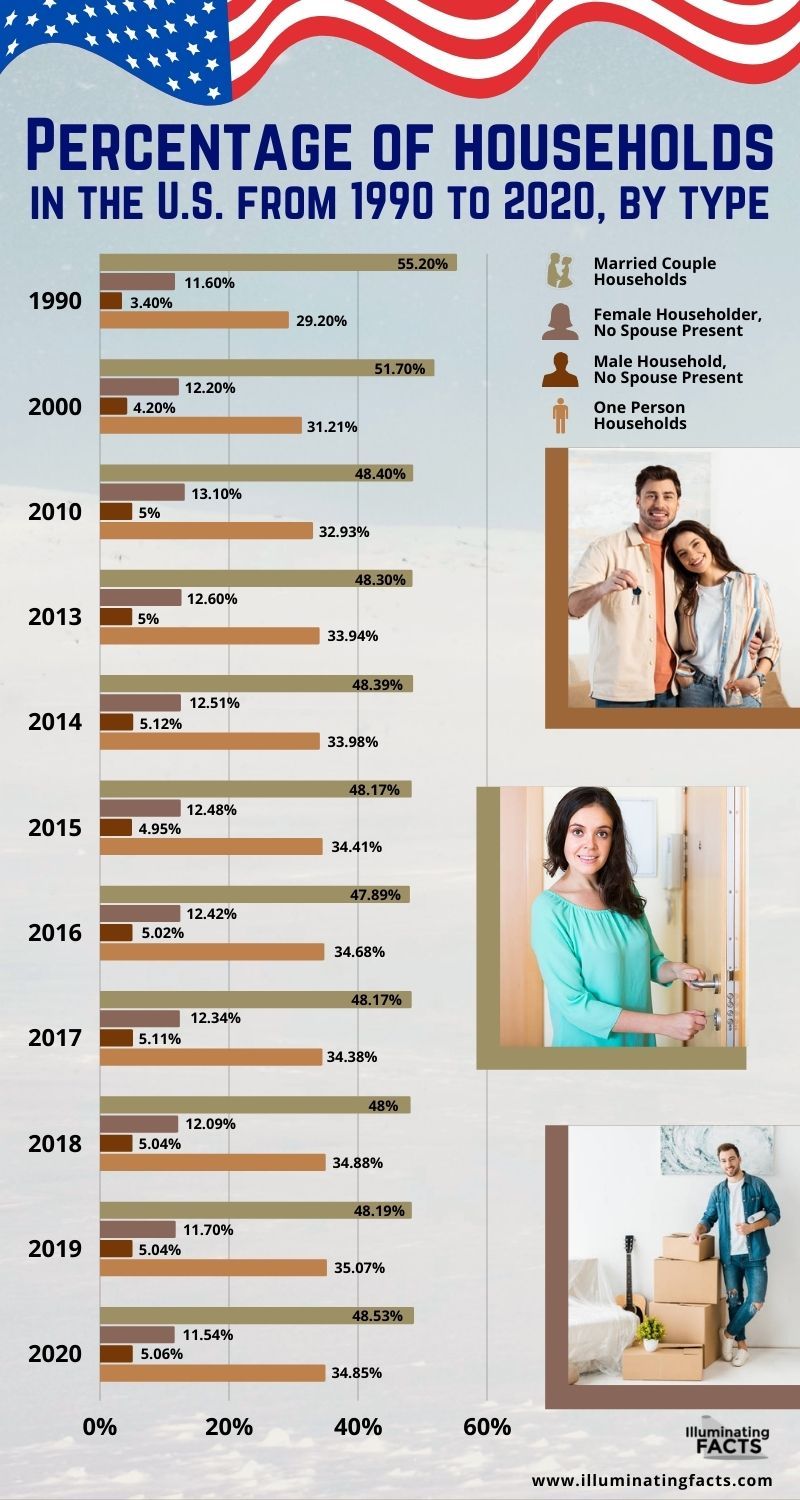
Percentage of Households in the USA from 1990 to 2020, by type
Household structures have changed within the United States in the last 30 years. In 1990, 55.2% of households were married couples. By 2010, this percentage fell to 48.4%. In 2019, it fell even lower to 48.19%. This shows that the overall trend of married couple households has been reducing. Similarly, single-female households were 11.6% in 1990 and rose to 13.1% in 2010. However, there was a fall after that and in 2020, they were again at 11.54%. Single Male households have increased from 3.4% to 5.06% between 1990 and 2020. Any other form of one-person households were
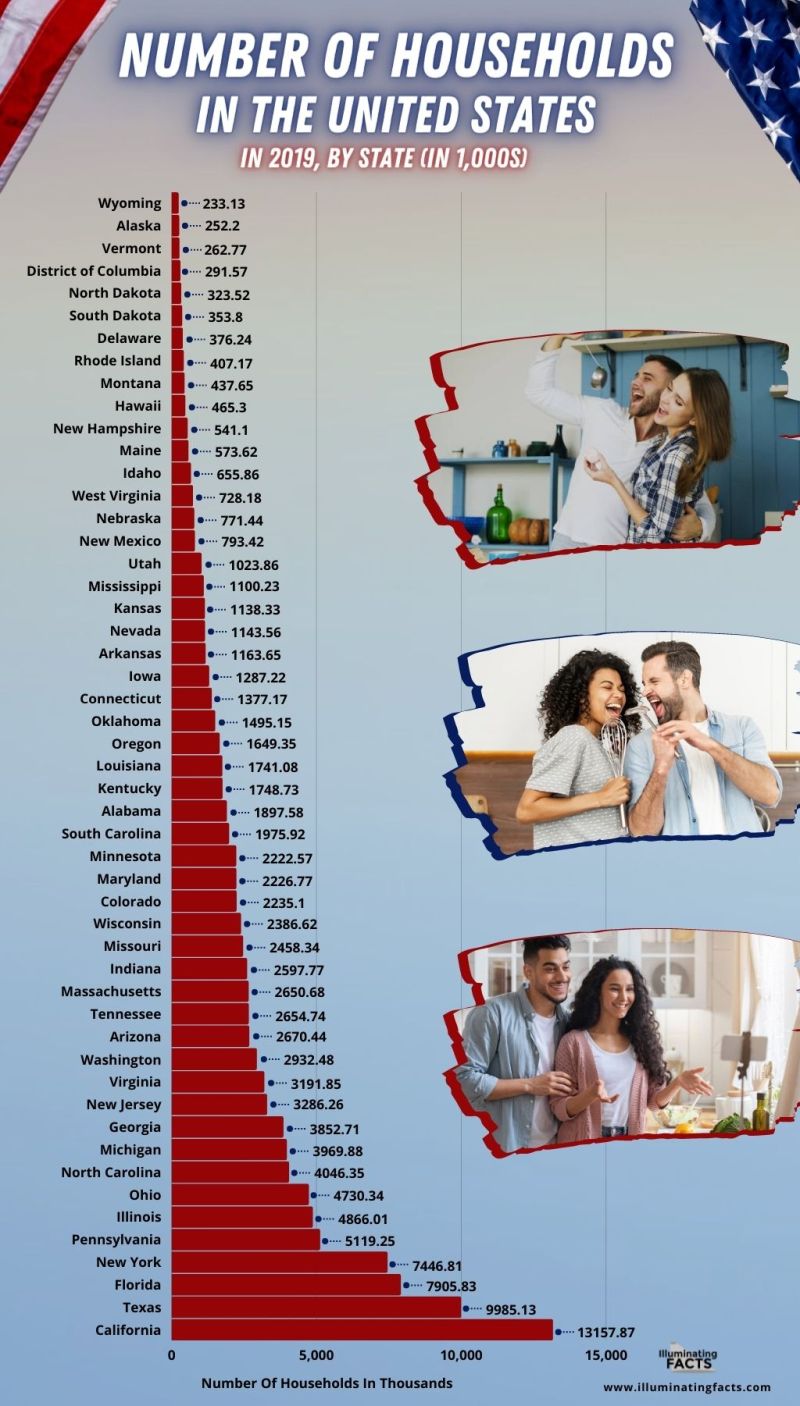
Number of Households in the USA, in 2019, by State (In 1000s)
The households in the US are well-spread. However, some states have a higher population which is why more households exist in these states compared to others. California has the most number of households in the USA. As of 2019, there were 13,157,000 households in California. Texas came second with 9.985 million households. Florida and New York have 7.9 million and 7.4 million in terms of the number of households in the USA in 2019. The graph also highlights other major states in the USA along with the number of households that reside in them.
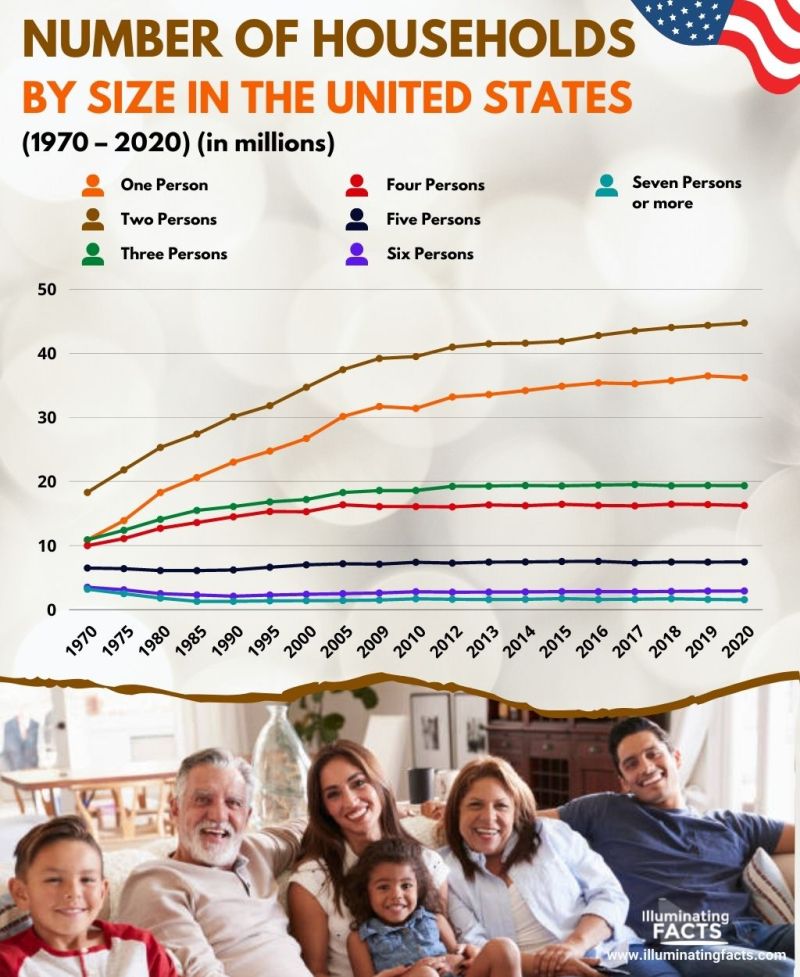
Number of Households in the USA from 1970 – 2020, by Size (In Millions)
By size, the number of households in the USA has increased over the past 50 years. As of 1970, two-person households were the most famous ones and were approximately 18 million within the US. One-person households were also seen and they were a little over 10 million. Three-person or more than three-person households each were 10 million or fewer. From the graph, it can be seen that within the coming 50 years, there was a substantial rise in the one-person and two-person households. One-person households crossed 44 million while two-person households were more than 35 million. This shows the increase in the trend of smaller households.
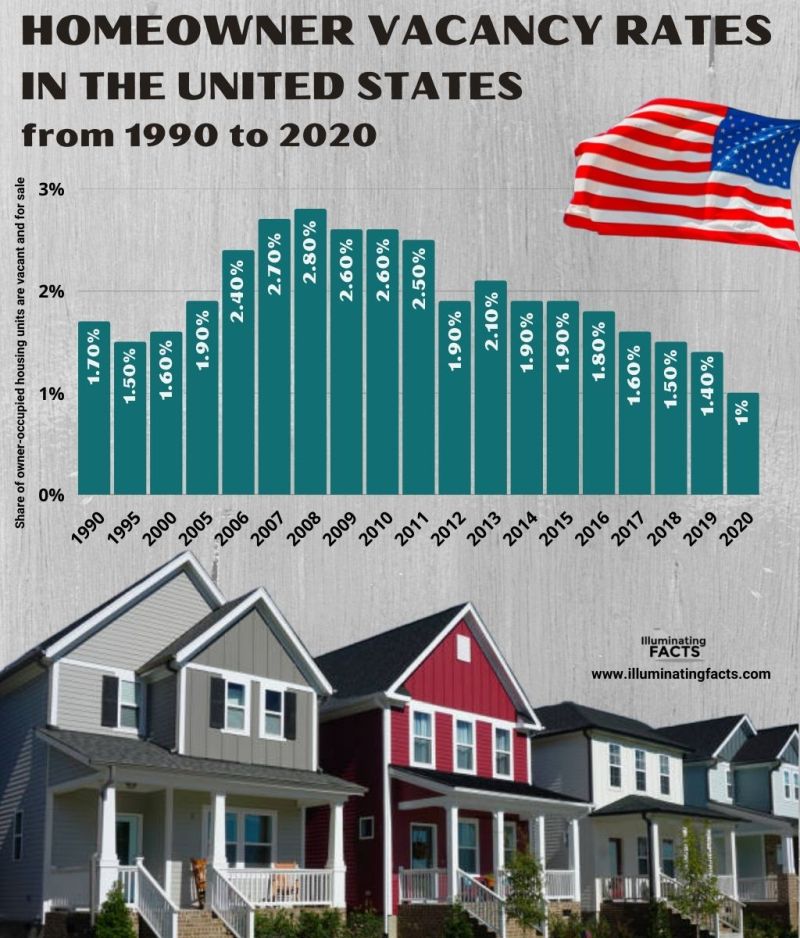
Homeowner Vacancy Rates in the US from 1990 to 2020
Most homeowners within the United States are living in their occupancies. However, few of them have kept them vacant from a business point of view to sell the homes and buy new ones in the future. The homeowner vacancy rates in the US have fluctuated massively between 1990 and 2001. As of 1990, homeowner vacancy rates were 1.7% and dropped to 1.5% in the next year. However, there was a consistent rise after that. In 2008, the homeowner vacancy rates were 2.8% and at their peak. From this time, there was a consistent fall in the homeowner vacancy rates and dropping to the lowest possible point of 1% by 2020.
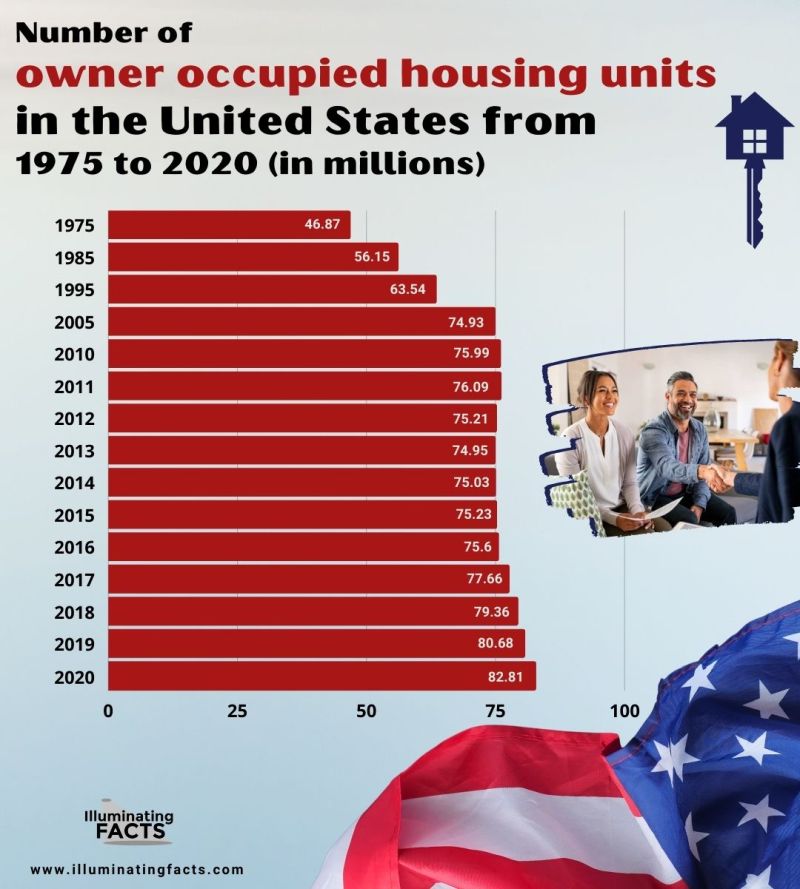
Number of owner-occupied housing units in the United States from 1975 to 2020 (In millions)
Owner-occupied housing units include all those housing units where owners are living and have not rented them to anyone else or kept them vacant. As of 1975, there were 46.87 million housing units occupied by the owners. This number kept on increasing as more people were able to purchase their houses as well as get away from rented accommodation. By 1995, there were 63.54 million housing units in the US that were occupied by the owners. In 2005, the number again rose by more than 9 million housing units and reached 74.93 million. As of 2020, 82.81 million housing units are in the acquisition and occupation of their owners within the US.
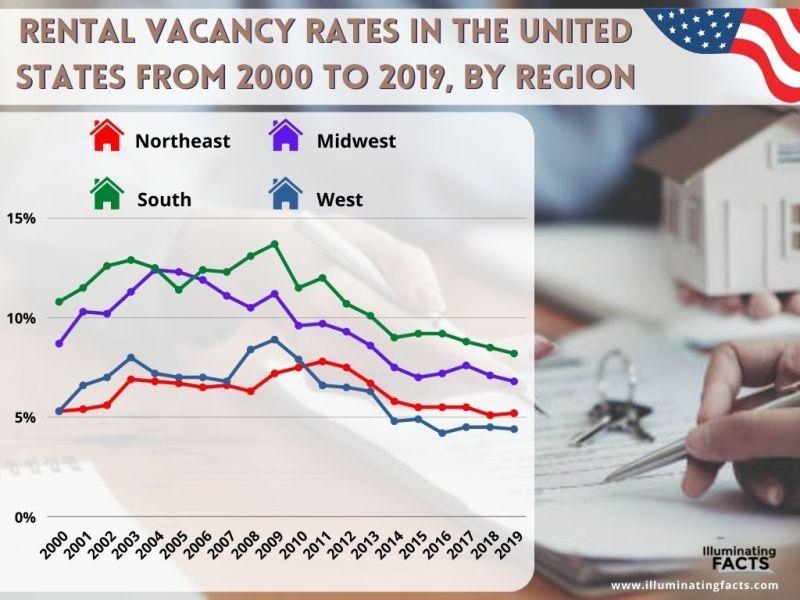
Rental Vacancy Rates in the United States from 2000 to 2019, by region
The rental vacancy rates have been quite fluctuating in the US between 2000 and 2019. In 2000, Northeast Rental Vacancy Rates were the lowest at only 5.2%. They rose to 7.5% by 2011 but then came back to 5.1% in 2019. Midwest Rental Vacancy Rates were around 8% in 2000 and reached the maximum in 2005 at about 12% and then kept declining. In 2019, they were only at 7.5%. Similar was the case for South Rental Vacancy Rates which were 11% in 2000 and went beyond 13% in 2009. After that, there was a decline and in 2019, they were at 8%. Lastly, West Rental Vacancy Rates started from 5.2% and reached 8% in 2009 after which they went into a decline. In 2019, West Rental Vacancy Rates in the US were 4.7%.
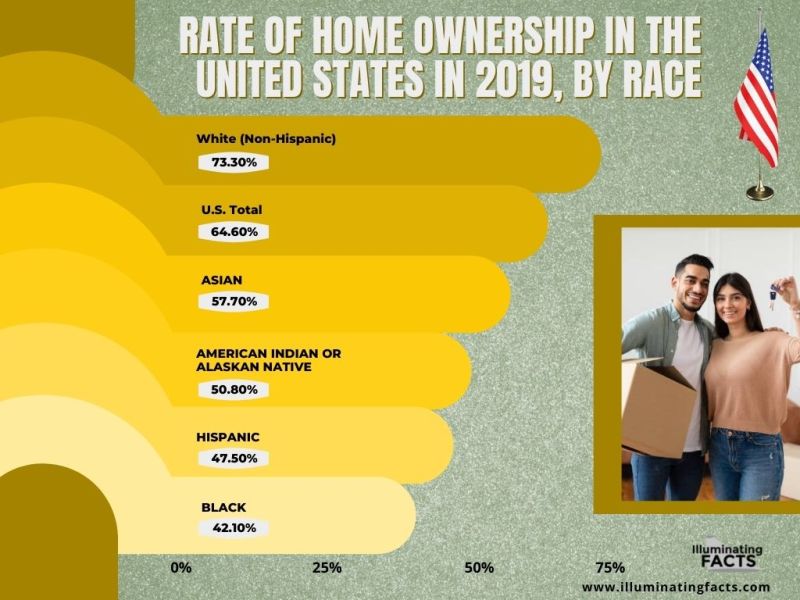
Rate of Home Ownership in the United States in 2019, by race
This is one of the most interesting graphs as it highlights the connection between homeownership as well as a race within the United States. It has been seen that 73.3% of Whites own a home in the US. While the second most popular race in the US is African-Americans, they aren’t the second in the rate of homeownership. Instead, it is the Asians. 57.7% of Asians had homeownership in the US as of 2019. 50.8% of American Indians also have homeownership in the USA. 47.5% of Hispanics and 42.1% of Blacks also have homeownership in the USA.
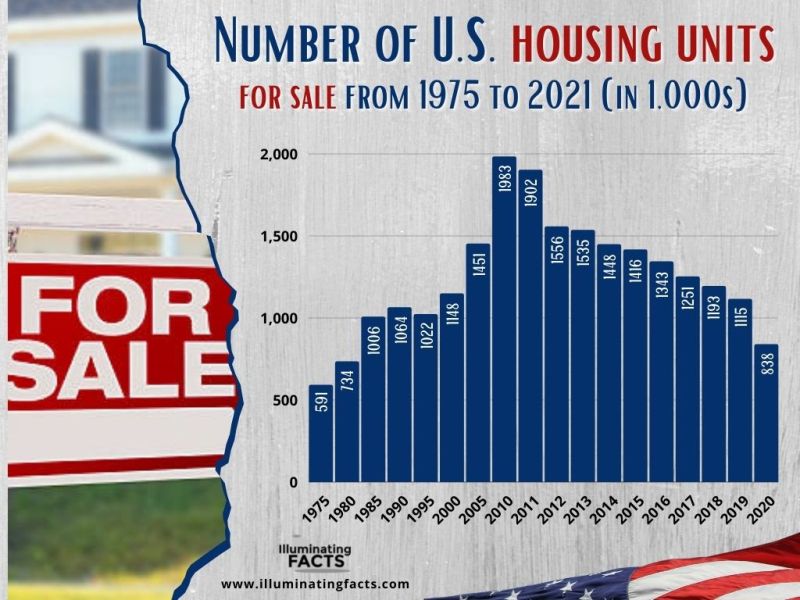
Number of US Housing Units for Sale from 1975 to 2021 (In 1000s)
Housing units in the United States were once quite affordable which is why they were high in demand too. People could easily buy them. However, the trends have changed as the number of housing units for sale has reduced due to several reasons. In 1975, there were 591,000 housing units for sale in the US, and reached a whopping high figure of 1,983,000 housing units in 2010. This was the peak time and after this year, there was a constant fall in the number of housing units for sale. As of 2021, there were 838,000 housing units for sale in the US. Most people prefer to live in houses nowadays rather than sell them.
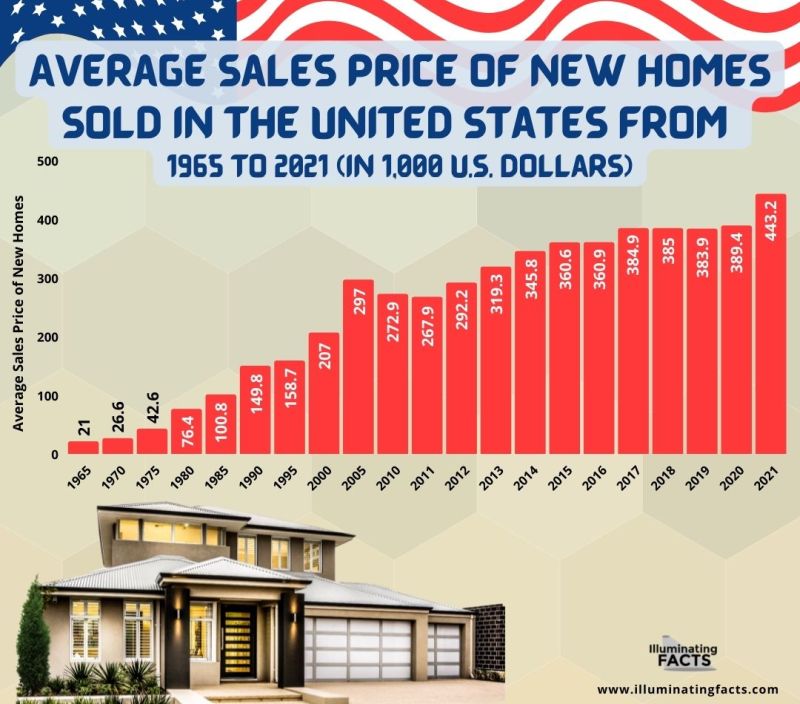
Average Sales Price of New Homes Sold in the United States from 1965 to 2021 (In 1000s US Dollars)
One reason why the number of housing units for sale in the USA has reduced is that the prices have gone high and people can’t buy housing units. As a result, builders have reduced building housing units and instead, focused on flats, or other rentable accommodations. In 1965, the average sale price of a house in the US was only $21,000. In the coming 35 years, there was a 9.5x increase in this sale price as the average price went up to $207,000. There were minor fluctuations in the average price but a consistently positive trend was seen when the price of housing units for sale reached $443,200.
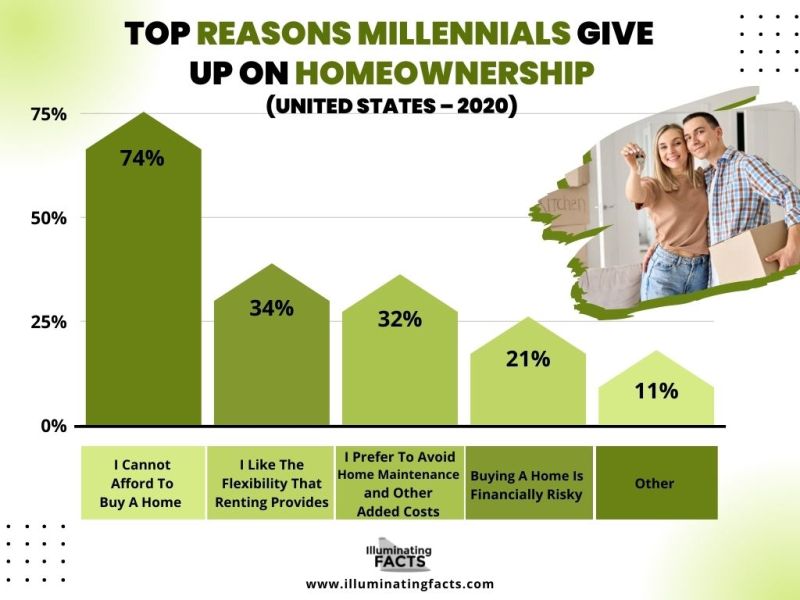
Top Reasons Millenials Give up on Home Ownership (2020)
Millennials are people who were born between 1981 and 1997. In general, anybody seeing their adulthood in the 21st century is considered to be a Millenial. These people have experienced a massive influence of technology and changing socio-economic environments along with a massive rise in inflation as well. For this reason, 74% of Millennials believe that they have given up on homeownership because they can’t afford to have one. 34% liked the comfort and flexibility factor which is there in case of rented accommodation. 32% suggested that they wanted to avoid any kind of burden of home management seen in the case of homeownership. 21% believe that building a home is financially risky while 11% have other reasons for giving up on homeownership.
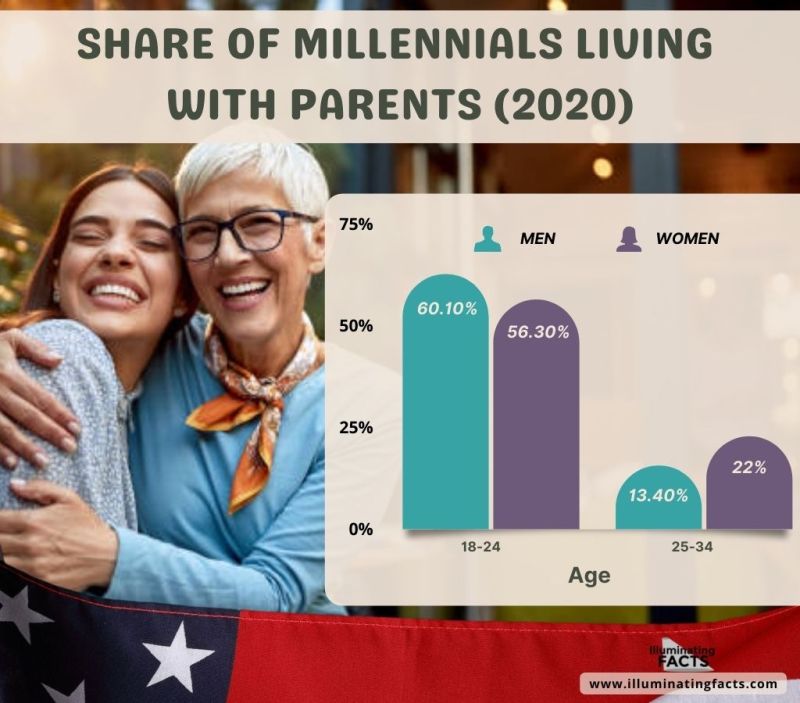
Share of Millenials Living with Their Parents (2020)
As seen from the previous graph, the majority of Millenials are not interested in homeownership. As a result, many of them have been living with their parents. This is because many don’t even want to pay the rent. From statistical surveys, it has been found that 60.1% of men aged 18-24 and 56.3% of women aged 18-24 are living with their parents. Surprisingly, even older millennials have a significant proportion of them living with their parents. 13.4% of men aged 25-34 and 22% of women aged 25-34 are also living with their parents. This also shows that more women are dependent on sharing accommodation with their parents as compared to men.

