There was a time when only one of the parents used to work while the other had the responsibility to manage the home as well as the kids (if any). Mostly, men used to work and women used to stay at home. However, the modern culture and trends have changed and households are emerging which have both parents working. In the United States, this trend is growing rapidly and has its pros and cons too. We can evaluate the growth of two-parent working families in the United States with the help of the following graphs.
Find Out More…
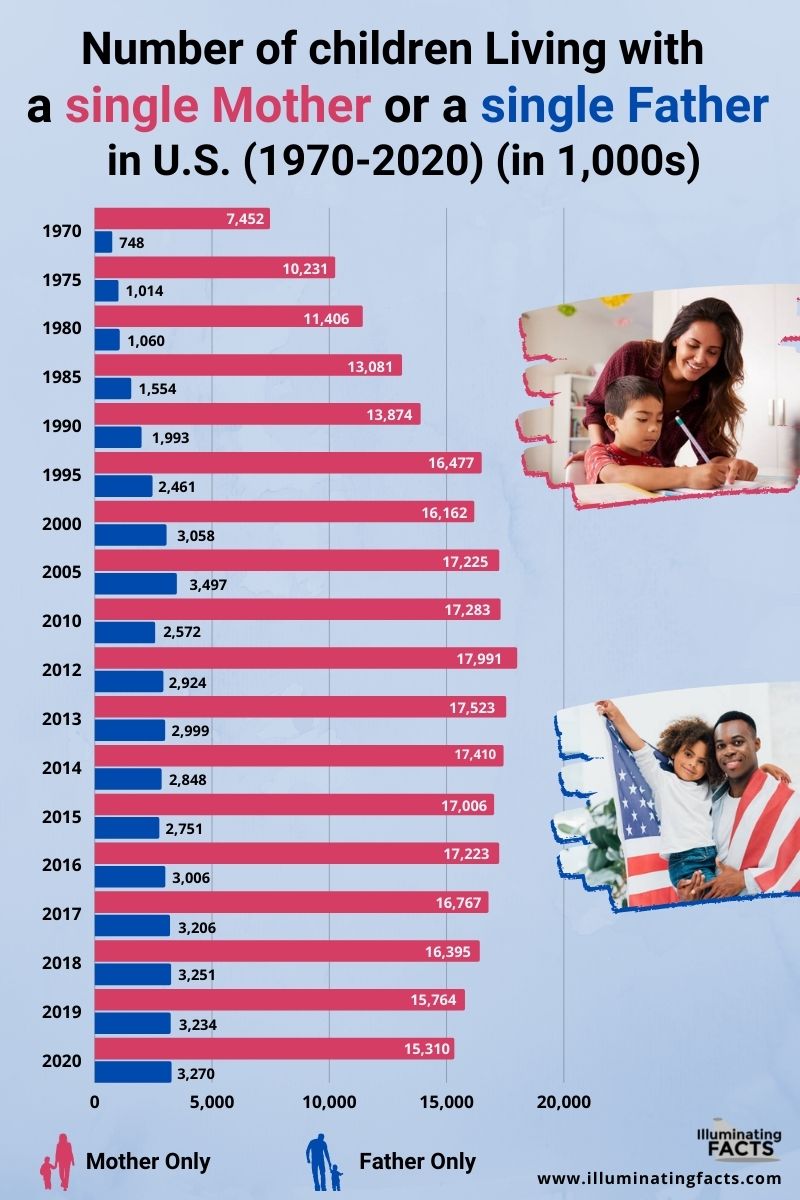
Number of Children Living with a Single Mother or Single Father in the US (1970 – 2020) (In 1000s)
In the United States, it has been seen that more children are living with single mothers as compared to single fathers. The number of children living with a single parent has increased over the past few years. In 1970, 7,452,000 children lived with their mothers and 748,000 lived with their fathers. In 2000, The number of children living with their mothers only were more than 16 million while those living with fathers were a little over 3 million. In the coming years, there have been ups and downs but the general ratio has stayed the same. According to the latest statistics, in 2020, 15.3 million children lived with their mothers while 3.2 million lived with their fathers alone.
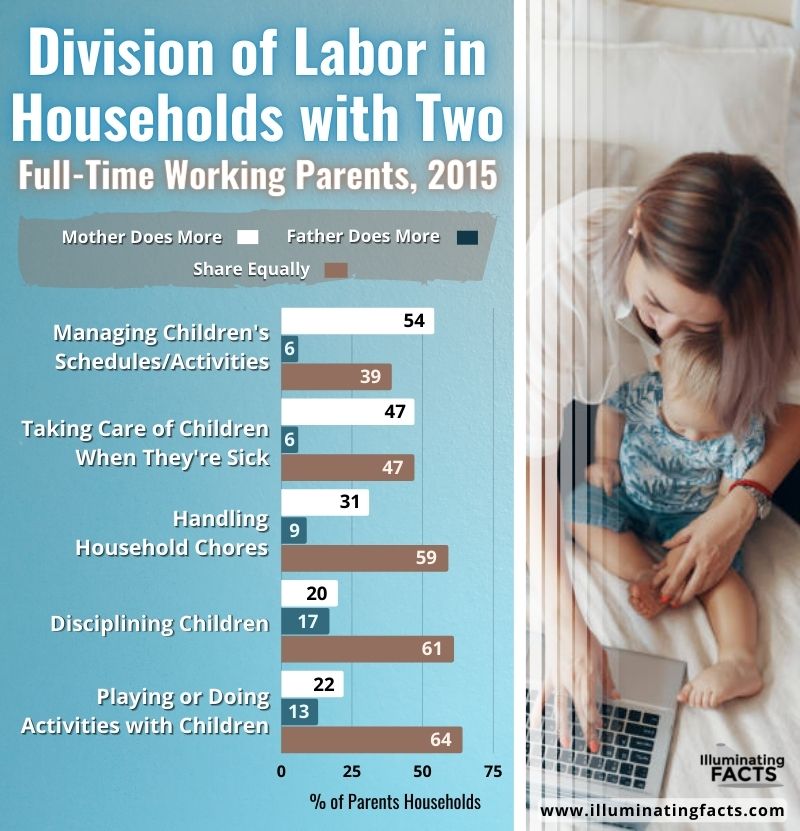
Division of Labor in Households with 2 full-time Working Parents, 2015
Working parents find it very difficult to manage their households, especially when they have kids to deal with. However, in a general trend, it has been seen that full-time working parents have either the mothers working more or both of them sharing the workload. Fathers alone don’t work as much. For example, it can be seen that 54% of households have mothers managing children’s activities while 39% have both parents share the responsibility. Only 6% have fathers alone managing it all. All other areas show a similar trend.
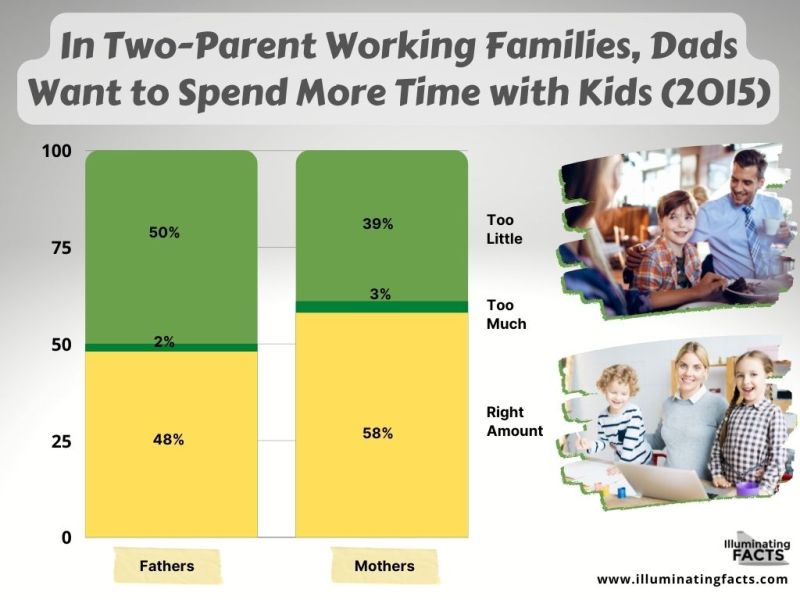
Time Spent by Mothers and Fathers with Kids (2015)
A study conducted in 2015 showed that fathers want to spend more time with their kids. It shows that 50% of fathers spend too little time with their children while 2% spend too much time with their children. 48% of fathers believed that they spent the right amount of time with their children. For the case of mothers, it can be seen that 39% believe they spent too little time with their children while 3% believe that they spend too much time. 58% of mothers believe that they spend the right amount of time with their children. This shows that dads want to spend more time with their children.
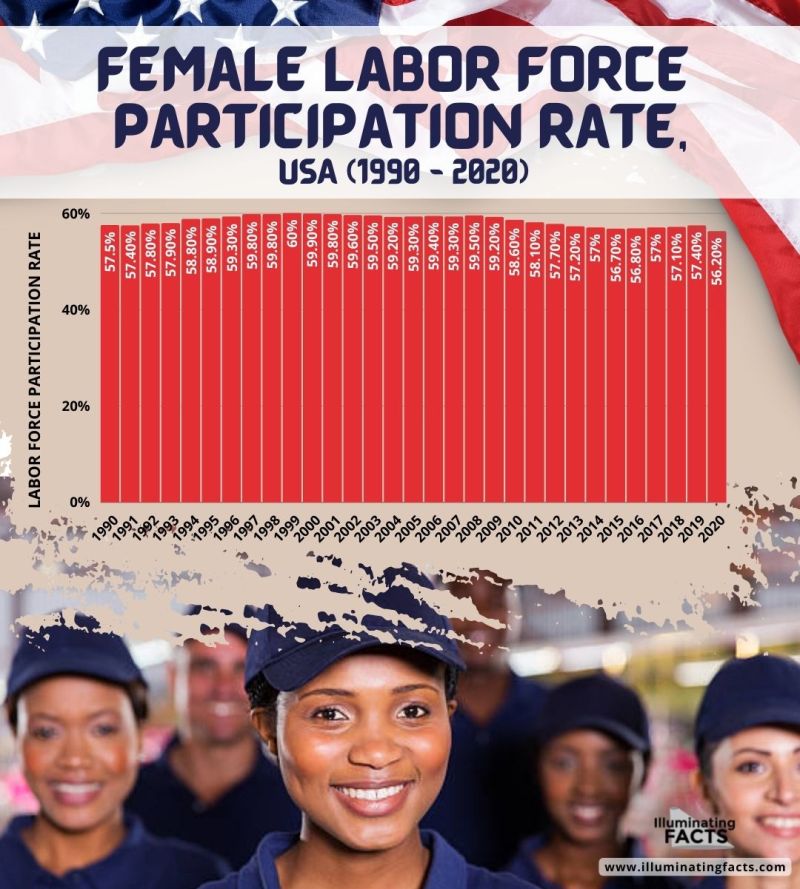
Female Labor Force Participation Rate
The female labor force participation rate has stayed fairly the same over the past many years. There have been slight ups and downs but an overall trend has stayed the same between the 30 years between 1990 and 2020. By 1990, the female labor force participation rate was 57.5% which maxed in 1999 when it reached 60%. Since then, there have been dips and pushbacks but the 60% benchmark hasn’t been achieved again. By 2020, only 56.2% female labor force participation rate remains. This means that the trend of women’s participation in labor work might reduce in the near future.
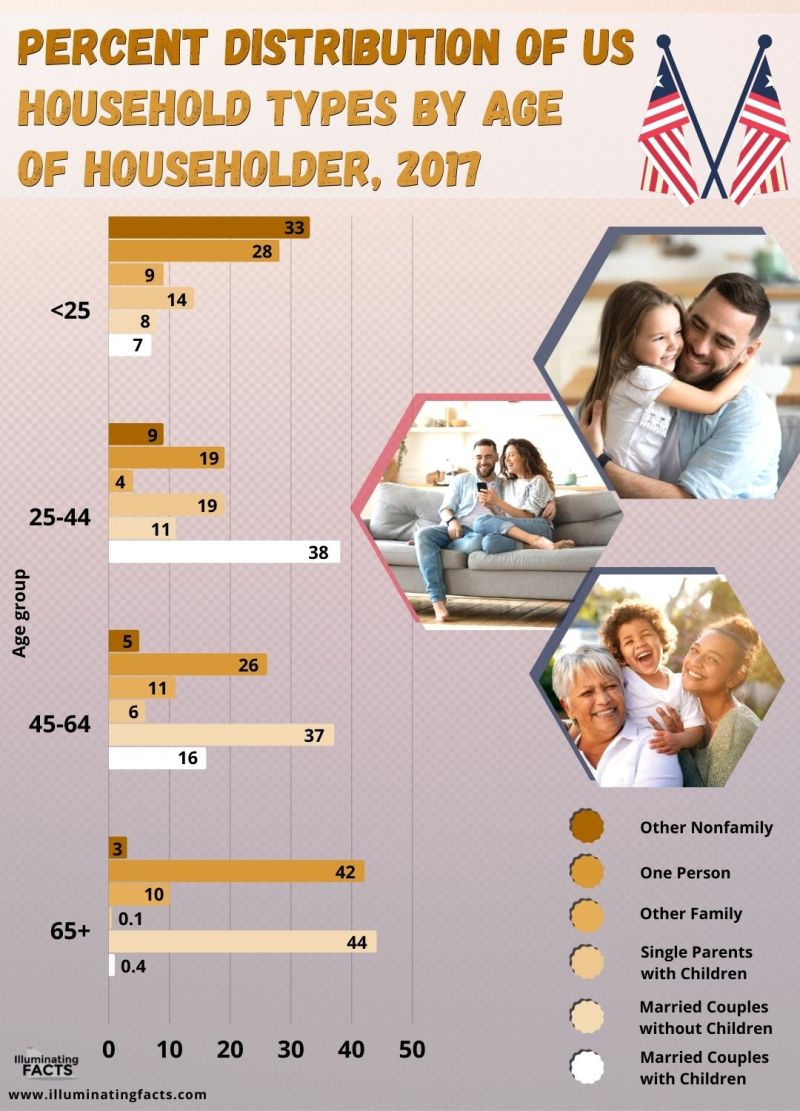
Percent Distribution of US Household Types by Age of Householder, 2017
The US Household types have different types of people living in a household. The following graph categorizes them on an age differential basis. 28% of people under 25 are living in a 1-person household. 9% are living with a family. 14% are single parents with children while 8% are parents with children. 7% are couples without children. 33% belong to other non-family households. All the other age groups in the graph show the relative proportions of the households to which they belong.
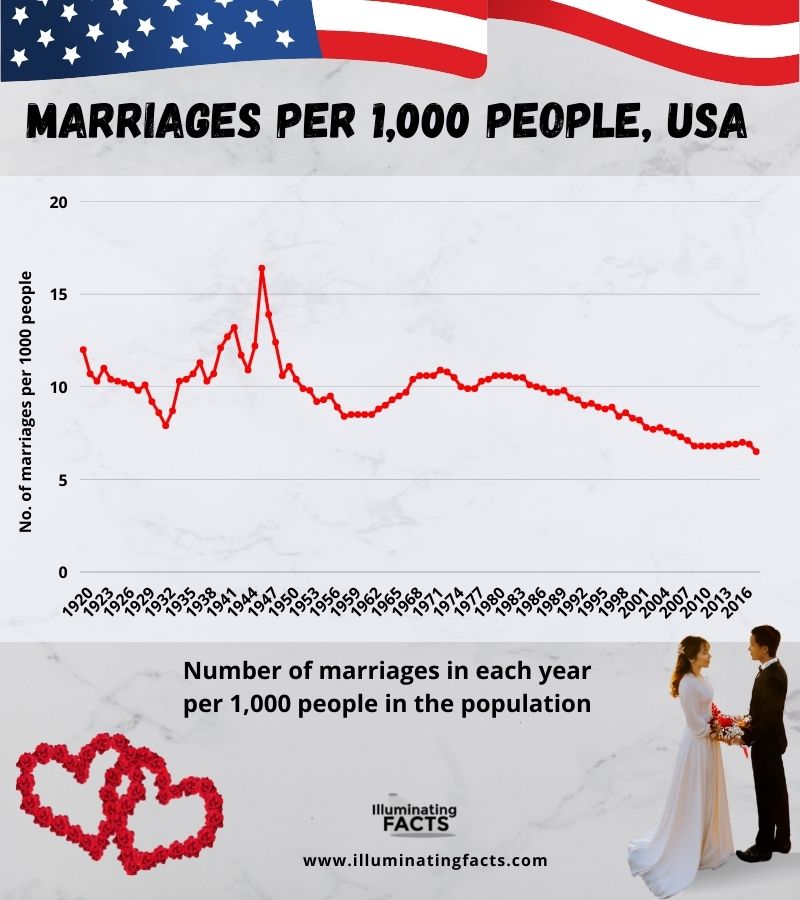
Marriages per 1000 people, USA
The overall trend of marriage within the US has been decreasing for the past many years. A few believe that this is because of the added legal complications and the possible consequences of separation and divorce which is why many couples prefer to live non-married. In 1920, there were almost 12.5 marriages per 1000 people in the USA. It dropped to an all-time low in 1932 when there were only 7 marriages per 1000 people. A peak time was seen in 1947 when there were 16.6 marriages per 1000 people. Following this year, there has been a constant decline with slight upward fluctuations. As of 2016, there have been less than 7 marriages per 1000 people in the USA.
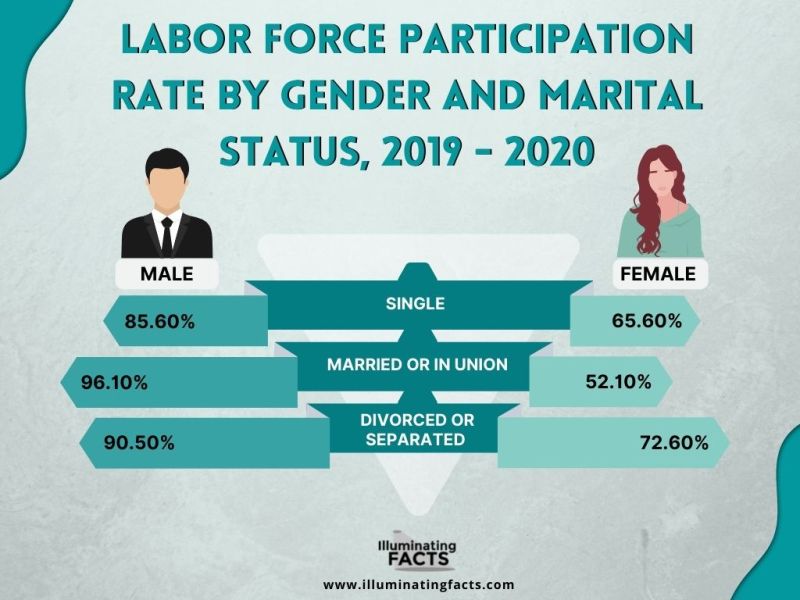
Labor Force Participation Rate by Gender and Marital Status, 2019 – 2020
Many couples decide that only one of them should work and the other should manage the home which is why the labor force participation rate by gender and marital status has been quite fluctuating. Records from 2019 – 2020 show that 85.6% of single males and 65.6% of single females were a part of the labor force. In retrospect, married or men in relationships were 96.1% employed in the labor force while 52.1% of females with any relationships were employed in the labor force. 90.5% of separated or divorced men were a part of the labor force while 72.6% of divorced or separated females were a part of the labor force in the same period.
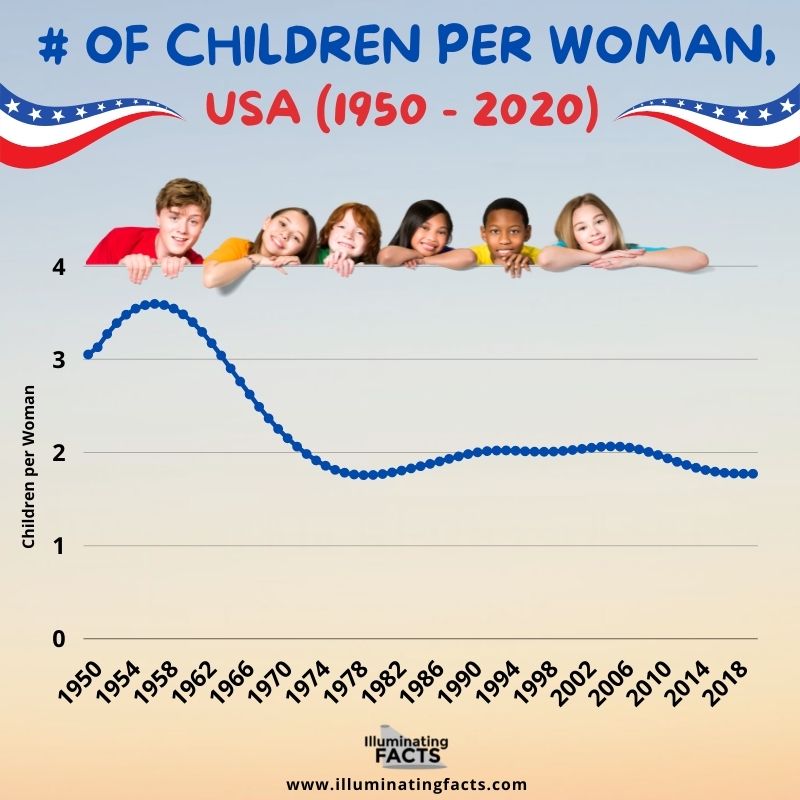
Number of Children Per Women in USA (1950 – 2020)
The number of children per woman in the USA fluctuated for a long while in the earlier times. However, recently, this number has stayed fairly the same with minor fluctuations. As of 1950, there were 3 children per woman in the USA on average which increased to 3.5 children in 1958. This was the maximum and a major fall was seen after that in the coming years. By 1978, there were only 1.8 children per woman in the USA. Since then, this number has fluctuated around 2 children per woman. It can be interpreted from this graph that fewer children are being born in the US.
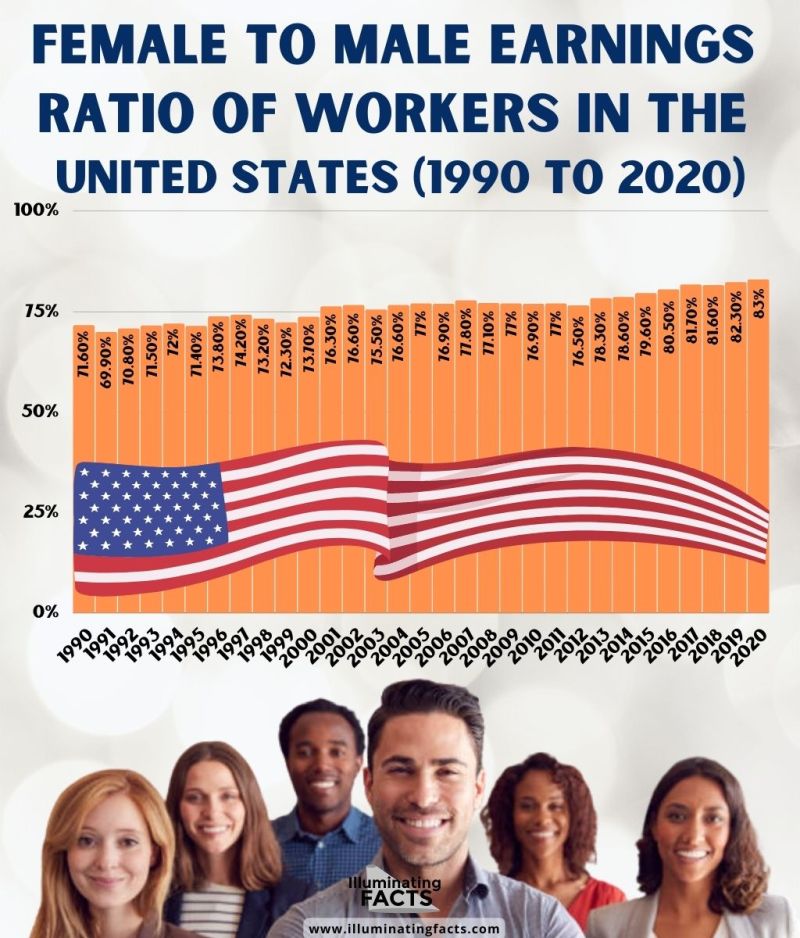
Female to Male Earnings Ratio of Workers in the United States (1990 – 2020)
Female-to-Male Earnings Ratio of workers means how much females earn with regards to male earnings for the same type of job. In general, women are usually paid less for some tasks as compared to men as men can usually perform physically exerting tasks while women cannot. Besides, men are sometimes invested in 2-3 jobs while women aren’t. In 1990, the female to male earnings ratio was at 71.6% and reached the lowest in the 30 years from 1990 to 2000 in the next year. In 1991, this ratio was at 69.9%. It then kept increasing and crossed 75% in 2003. By 2016, this ratio reached 80%, and most recently, in 2020, this ratio reached 83%. This shows that women are earning better and much closer to men.


