

Background
When planning an event in a certain venue, designing a building, or conceptualizing a product, it is always important to consider the number of people that will be involved. These are the times when crowd size visualization may come in handy. In general, a crowd is defined as a group of people that have gathered for a common purpose or intent. It could be attending a demonstration, a sports event, or even during looting. But aside from that, a crowd may also pertain to people going about their business in a busy area. [2] When compared with masses, crowds can be defined by their shared emotional experiences, while masses are defined by their interpersonal isolation. In human sociology, the term “mobbed” means “extremely crowded,” like in a busy mall or shop.
If you are going to launch a certain product, it’s great to think if you can introduce it to a million people. That is now possible as we have the internet, and millions of people are indeed using online platforms to reach one another. However, the difficult part is imagining what a million people look like. Can you imagine standing on a stage and presenting your product to a million people? [1]
It is easy to imagine one person, ten, or maybe twenty-five. However, when it exceeds a couple hundred, most people’s imagination falters. The higher the number of people gets, it becomes just a number and stops feeling like people. With this, the professed implication for the population begins to lessen. [1] If you are also interested in visualizing different sizes of crowds, you’re in the right place. In this post, we are going to give you more information on how you can effectively visualize crowd sizes.
How to Visualize Crowd Sizes

When a lot of people are in the same place at the same time, it is easy to visualize crowd size. However, for people who work in the tech industry and planning to launch a software product, it’s quite challenging to imagine crowd sizes. For example, if they are working on a tool that has 2,000 people using it, it will be easier to think that this number would fit in a certain theater somewhere, as you can also imagine the noise and activity they make. With this specific crowd in mind, the minds of the people creating the tool will change when it comes to thinking about the people who are using the features they build. [3]
Visualizing crowd sizes can be done in various ways. These may include comparing the number of people to common places and events, doing computations, or through the use of modern applications and sites.
Visualizing Crowds in Common Places and Events
If you are going to talk in front of an audience, visualizing how big that audience size look is quite fun. [4] It is exciting to soak up the atmosphere created when many people are in the same physical space at the same time. [3] However, when you find it challenging to imagine what a crowd of 100, 500, 1,000, 10,000, 100,000, and so on would look like, the technique is to start thinking about real people in real places or events. Take a look at the infographic below for examples:
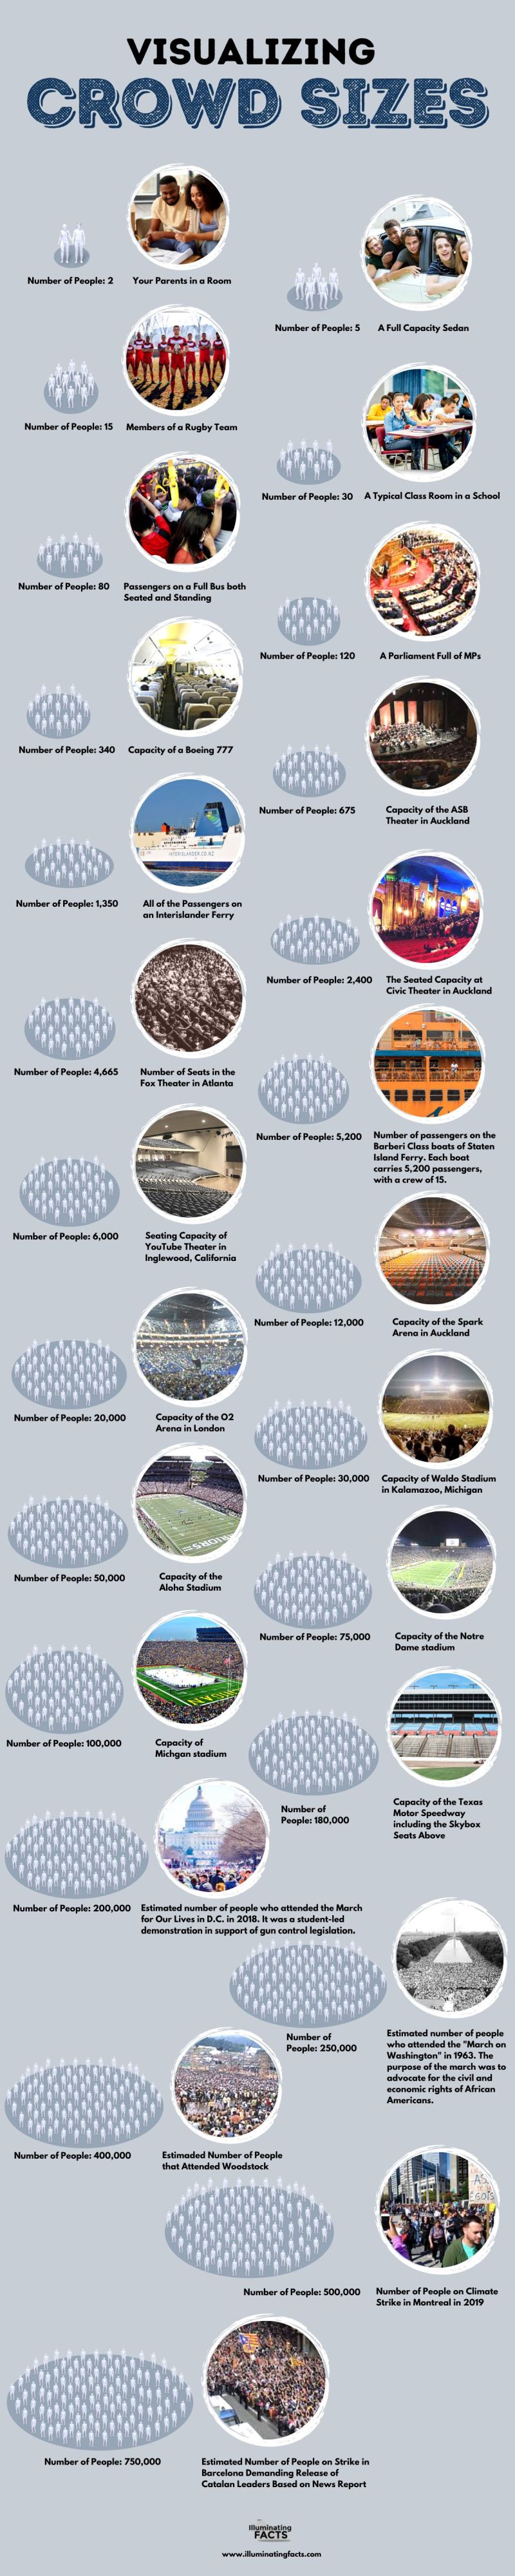
As mentioned earlier, it’s easy to visualize what a crowd of ten or maybe twenty-five people looks like. A crowd of thirty is equivalent to a whole class at school. When you imagine 50 people, you can visualize an average audio-visual room filled with people watching a presentation. A crowd of 80 people, on the other hand, can fit in a bus with some seated and others standing.
If there are 100 to 150 people in a theater where you have to present something, that will make most people nervous. When the crowd reaches 250, they can all fill up a small church or a lecture hall. If you want to visualize a crowd of 340 people, you can imagine a Boeing 777 full of passengers. If you raise the number of people to 675, they can fill the seats in the ASB Theater in Auckland.
You need to visualize an even bigger theater for 1,000 people. And for a crowd of 3,000, they would barely fit most theaters, and some are going to have to stay outside. For a crowd of 10,000, imagine the audience in a game in a football stadium. But where can 20,000 people fit? Well, the O2 Arena in London can accommodate them well.

If you want to visualize even bigger crowds, you can think of Waldo Stadium, which can hold 30,000 people. There is also the Aloha Stadium, which holds 50,000 people, the Notre Dame Stadium, which holds 75,000 people, and the Michigan Stadium, which holds 100,000 people. For a crowd of 180,000 people, you can imagine the Texas Motor Speedway in full capacity, including its skybox seats.
For crowds ranging from 200,000 to 750,000, it can be easier to visualize them through past events that have occurred in certain places. For example, in 2018, there were an estimated 200,000 people who attended the March for Our Lives event in D.C., or back in 1969, an estimated 400,000 people attended Woodstock.
Looking at Historical Events with the Largest Crowds
It can be more difficult to visualize crowd sizes in millions. As we’ve mentioned earlier, the higher the number gets, the more challenging it is to think of people. If you are trying to visualize crowd sizes in millions, the best you can do is to search for historical events, take a look at photos and videos, and know where they took place. You can use these events to compare the size of the crowd you are visualizing. Take a look at the infographic below to learn about the events in history with the largest crowds:
Kumbh Mela 2013 and 2010

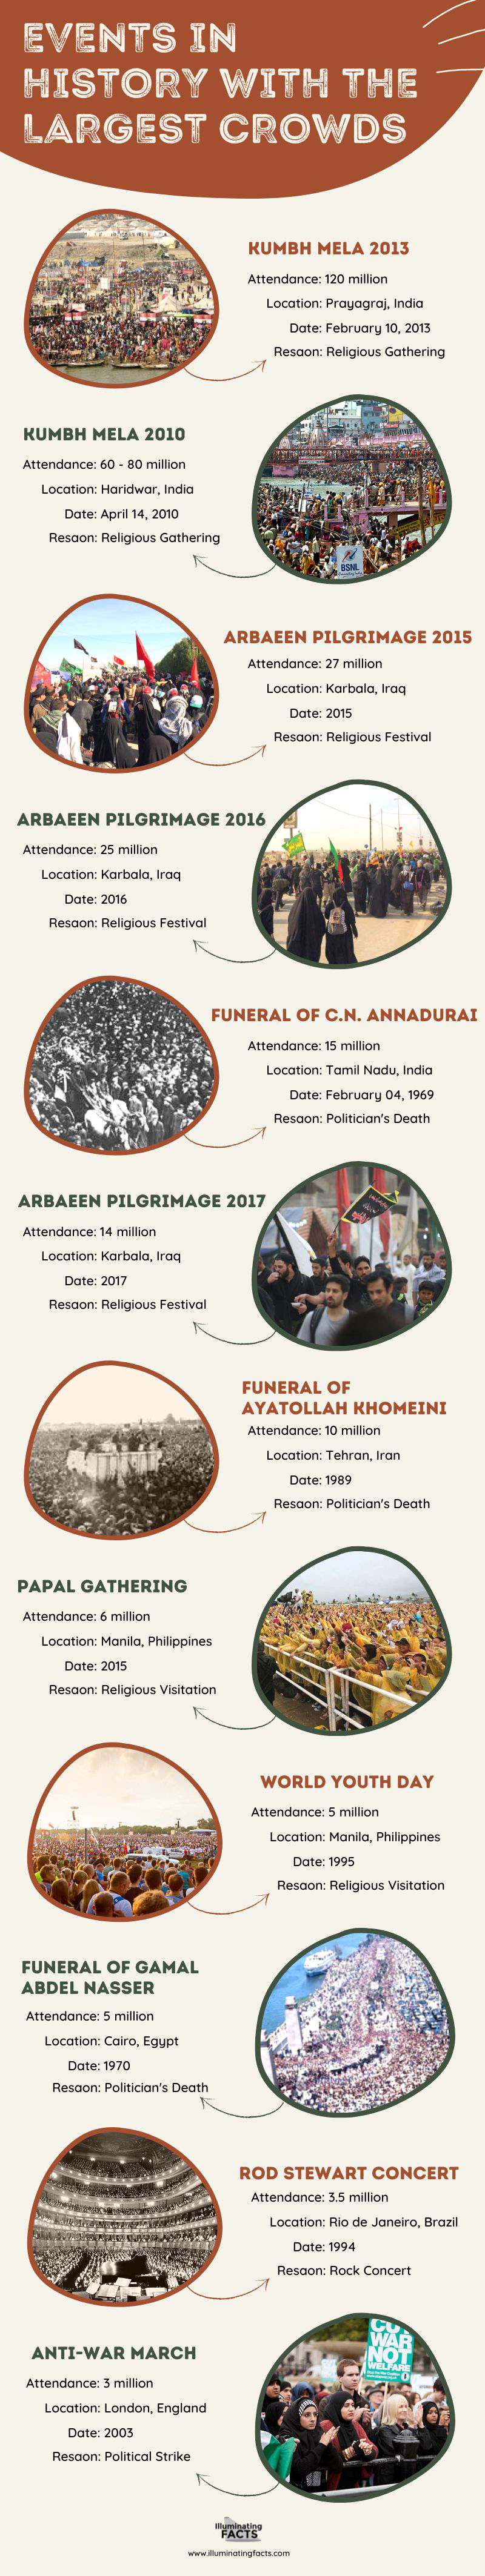
Kumbh Mela 2013 was the largest peaceful gathering of people ever recorded. It is a Hindu ceremony that is celebrated four times out of each 12-year period. The location of the gathering rotates between the four rivers that are held sacred by those of the Hindu faith. The event draws people from all types of lifestyles to celebrate their faith. The Kumbh Mela in 2010 was attended by a crowd of 60 to 80 million. Once the festival starts, it can last anywhere from one to three months. [5]
Arbaeen Pilgrimage

This is a festival that takes place in Karbala yearly. In 2015, a crowd of 27 million was in attendance, while a crowd of 25 million was present in 2016. It decreased to 14 million in 2017. In this event, people from all around the world gather in Iraq to honor the bereavement of Imam Hussain, the grandson of the Prophet Mohammed. [5]
Funeral of C.N. Annadurai
- Annadurai was a Dravidian leader and was the first Dravidian party member to serve as the first Chief Minister of Tamil Nadu. He braved a great deal of opposition and passed away after being diagnosed with oral cancer. His funeral in Tamil Nadu in India back in 1969 was attended by a crowd of 15 million. [5]
Funeral of Ayatollah Khomeini
Ayatollah Khomeini was an influential Iranian political and religious leader. In 1989, his funeral was attended by a crowd of 10 million. The service was actually composed of two separate funeral services, including pre-burial viewing and rites. [5]
Papal Gathering

In 2015, the papal visit to the Philippines was flocked by a crowd of 6 million people. They gathered to see Pope Francis speak in Manila for a mass even when the weather was rainy. [5]
World Youth Day
In 1995, World Youth Day in the Philippines was attended by 5 million people. It gave millions of young religious people the chance to meet the Pope. [5]
Funeral of Gamal Abdel Nasser

Gamal Abdel Nasser was the second president of Egypt. He led a long political career from 1954 to 1970 when he passed away. His popularity grew as he promoted unity among his people. His funeral in 1970 saw a jaw-dropping crowd of 5 million people. [5]
Rod Stewart Concert
In 1994, Rod Stewart had a rock concert in Rio de Janeiro in Brazil. This concert attracted a crowd of three and a half million. [6]
Anti-War March

In 2003, it was believed that about 3 million people marched through London to oppose the invasion of the US in Iraq. It was one of the most prominent anti-war marches in history. [6]
Visualizing Crowd Sizes Through an Online Tool

In addition to using common places and events as references in visualizing crowd sizes, technology also allows people today to check crowd sizes easier. This is done through an online tool called MapChecking. It was created by a French developer, Anthony Catel. [7]
To use the tool, you first need to visit the website. There, you will see a map where you can search the public space that you’d like to investigate. This will provide you an idea of the size of crowds that could fit in certain places. After searching for the place that you want, click on the borders of the area occupied by the crowd. The tool is flexible and allows users to select areas that are more complicated compared to simple rectangular spaces.
The difficult part of using the tool is guesstimating the density of the crowd. It’s because, according to experts, density at a public event is not homogenous. A better estimate of an area involves dividing it into several sections and estimating the density for each quadrant by looking at images of the place or event. Therefore, the MapChecking tool is only useful for visualizing stationary crowds. It may be difficult to use if you are going to visualize crowds in marches and demonstrations. Keep in mind that MapChecking only gives an estimate. But it can be very useful if you just want to get a simple visualization of a certain size of the crowd in a specific place. [7]
Crowd Size Estimation by Herbert Jacobs

A professor at the University of California Berkeley in the 1960s named Herbert Jacobs is credited with modernizing crowd-counting techniques. He created the most common method for estimating the number of people in a large crowd, which is known as the Jacobs Method. [8]
Jacobs noticed that the ground outdoors was gridded when he saw Vietnam War protests outside of his office window back in the 1960s. Therefore, he could count the number of protesters carefully, were in one square on the grid and then multiply by the number of squares. However, if the rally space is not gridded, knowing the total area and the density of the crowd is also enough.
The most tightly packed crowd is referred to as “mosh pit density.” It has one person for every 2.5 square feet. A more breathable crowd, on the other hand, puts one person per 4.5 square feet. However, you will still be elbow to elbow with other people. Therefore, when you break up the landscape into higher vs. lower crowd density chunks and multiply by their relative areas, you can get estimates of crowd size mostly within 10 to 20%. [8]
Essentially, Jacob’s Method involves dividing the area occupied by a crowd into sections, determining the average number of people in each section, and multiplying by the number of sections occupied.
Conclusion
Visualizing crowd sizes can be fun for many people, but it is also important for some. Essentially, estimating crowd size can help in keeping enormous groups under control if ever you are planning to host an event somewhere. It also helps event organizers and officials when it comes to planning how to manage traffic in a certain place, how many medical response personnel will be needed in case of an emergency, and the number of security people to hire. In addition, crowd size is also essential for media news reporting and historical documentation of the event. We hope this post helped you learn more about the techniques used in visualizing crowd sizes.
References
[1] Herath, A. (2021, September 6). Visualizing a million people. Visualizing A Million People · Strong Opinions, Weekly Held. Retrieved July 14, 2022, from https://xn--izc.com/blog/visualizing-people-2/
[2] Wikipedia, E. (2022, June 16). Crowd. Wikipedia. Retrieved July 14, 2022, from https://en.wikipedia.org/wiki/Crowd
[3] Simpson, R. (2020). Visualise An Audience. Rowan Simpson. Retrieved July 14, 2022, from https://rowansimpson.com/essays/visualise/
[4] Jack. (2021, October 26). Visualizing crowd sizes. Lime Link. Retrieved July 14, 2022, from https://blog.lime.link/visualizing-crowd-sizes/
[5] Levin, N. (2020, March 29). 10 largest gatherings of people ever recorded. Largest.org. Retrieved July 14, 2022, from https://largest.org/people/gatherings-of-people/
[6] Uddin, R. K. (2021, March 27). Did you know about these ten largest gatherings in human history that made us go “woah”! Siasat.pk News Blog. Retrieved July 14, 2022, from https://blog.siasat.pk/did-you-know-about-these-ten-largest-gatherings-in-human-history-that-made-us-go-woah/
[7] Mantzarlis, A. (2017, March 14). This online tool makes checking crowd sizes easier. Poynter. Retrieved July 14, 2022, from https://www.poynter.org/fact-checking/2017/this-online-tool-makes-checking-crowd-sizes-easier/
[8] Stierwalt, S. (2020, March 17). How do you estimate crowd size? Quick and Dirty Tips. Retrieved July 14, 2022, from https://www.quickanddirtytips.com/education/science/how-do-you-estimate-crowd-size