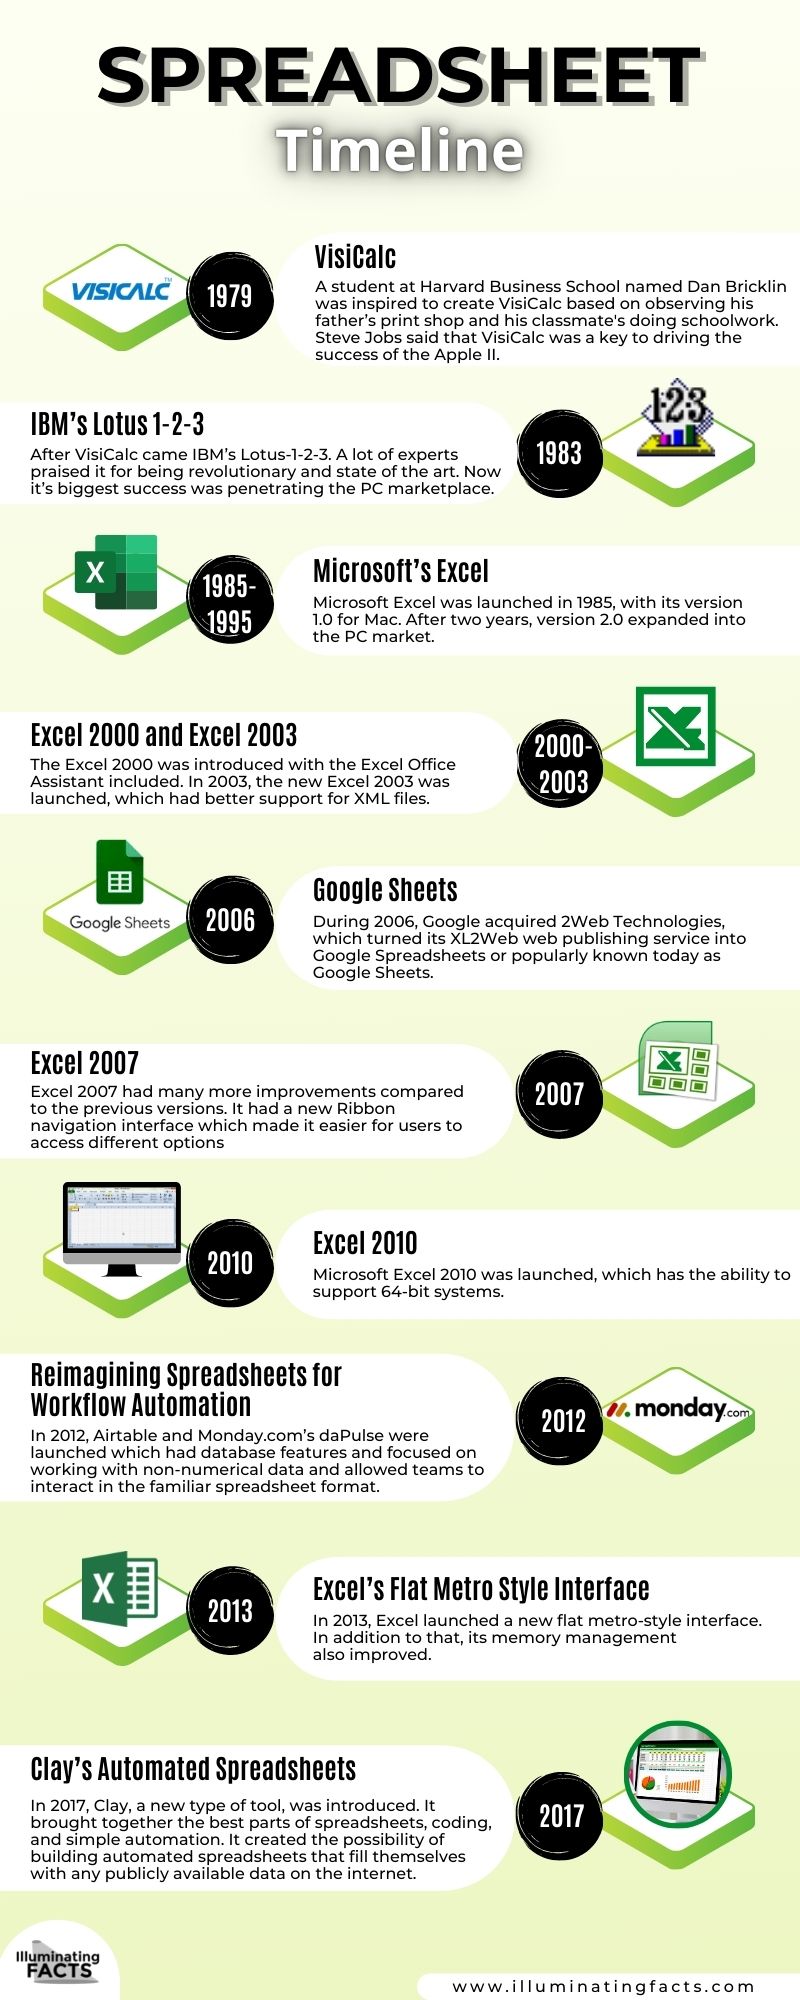
Spreadsheet usage is synonymous with large online databases and digital software. The tool has been organizing a number of aspects of our life for over hundreds of years. Today, it has become an integral part of a computer, and you wouldn’t find a single PC that doesn’t have any kind of pre-installed spreadsheet software.
Humans have been using columns and rows to organize information for as early as the Mesopotamian period. Back then, the spreadsheets would look like a ledger book with huge piles of paper laying out across the table. Columns and rows were drawn using pen or pencil to divide the information and the data was entered manually. With the evolution of time, different tools were introduced with improved features to ease up the whole process of data entering and saving.
A Spreadsheet is basically a computer program which shows information in two-dimensional grid along with formulas to relate the data. In the late 20th century, electronic version of spreadsheets has replaced its pen-and-ink versions. Moreover, the tool is not just limited to financial data anymore. In fact, it is frequently utilized to carry out computations and represent scientific statistics. Today, spreadsheets have become a significant part of online digital experience, and the constant evolution in the Spreadsheet’s World has proved that the tool is here to stay.
Have a look at the spreadsheet timeline to know about its transformation overtime.
