As we all know, vaccines are important for reducing the risk of diseases by strengthening your immune system. When you get a vaccine, your immune system responds.
There are many vaccines out there that have helped us fight against more than twenty potentially fatal diseases. They have allowed people of all ages to live longer and healthier lives. They currently save the lives of 4-5 million people each year from the diseases like diphtheria, tetanus, pertussis, influenza, measles, etc.
Vaccines are essential to good health and necessary for primary health care. They protect you against infectious diseases, which help keep communities safe from disease. They are the foundation of global health security and have become an important tool for fighting against antimicrobial resistance.
Despite the significant progress, far too many people around the world, including nearly 20 million infants each year, do not have the necessary access to vaccines. The progress has stopped and even reversed in some countries, and there is a real danger that self-satisfaction will undermine past achievements.
Find Out More…
Statistics and Graphs
Routine Vaccination

Routine vaccines are necessary for everyone in the United States, depending on the age and vaccine history. Most people think of these vaccines as childhood vaccines that you need to get before going to school, but however, there are also routine vaccines for adolescents and adults. These vaccines include Covid-19, chickenpox, Hepatitis A, Hepatitis B, Influenza, Tetanus, Rotavirus, etc.
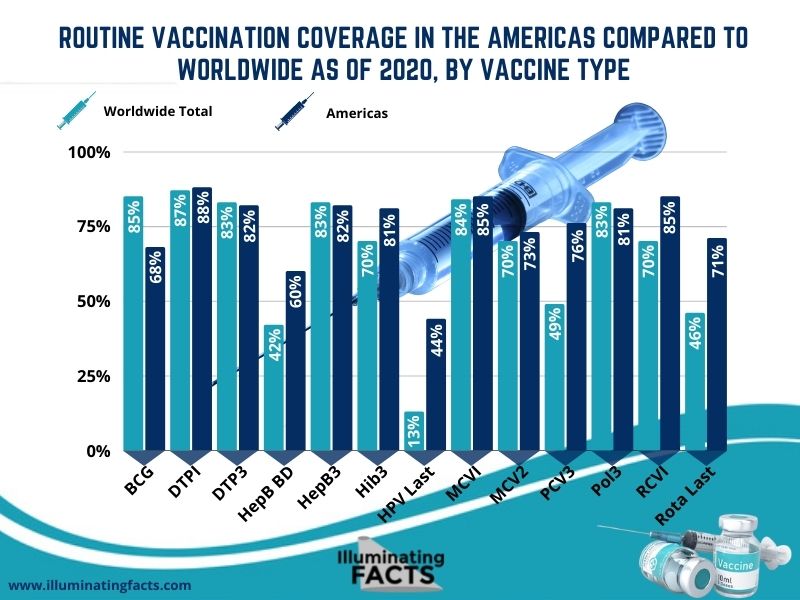
According to the above graphic, 85% of the worldwide population has been vaccinated for BCG compared to 68% of the Americas’ population. Surprisingly, the Americas’ population got more Rota Last, DTPI, MCVI, MCV2, and RCVI vaccines than the world population.
Deaths By Preventable Diseases
Vaccination prevents death every year in all age groups from diseases like diphtheria, tetanus, pertussis, influenza, and measles. It is one of the most successful and cost-effective public health interventions. An additional 1.5 million deaths can be prevented if the global vaccination coverage improves.
According to the above graph, the total number of deaths caused by tuberculosis decreased by 26.7081% in 1990 and 2017, thanks to the vaccine. In 1990, more than seven million deaths were linked to measles, but in 2017, that number decreased to only 95,290.
Morbidity and Mortality Rate
The terms “morbidity” and “mortality” are often used in epidemiology. Even though they are related, they refer to different things. Morbidity and mortality are frequently expressed as a percentage or rate.
Morbidity means that a person has a specific illness or condition. Heart disease, diabetes, and obesity are examples of common morbidities. You can have multiple morbidities at the same time. This is referred to as comorbidity.
On the other hand, mortality is the number of people in a population who die every year. A few common causes of mortality in the US are heart disease, cancer, and unintentional injuries. COVID-19 makes up a large percentage of the mortality rate in the country as well.
As shown in the graph above, the percentage of morbidity and mortality due to rubella and measles reduced significantly from 1998 to 2020, thanks to the vaccine and the safety precautions that weren’t there in the past.
Smallpox
The vaccination has been very effective in preventing smallpox infection in 95% of the people who have been vaccinated. Throughout the years, the smallpox vaccine has been helping people to fight smallpox by developing immunity against it. The vaccine is made from vaccinia, a poxvirus similar to smallpox but less harmful.
The vaccine contains a live vaccinia virus, not the one that is weakened or killed like other vaccines. As a result, people need to take care of their arms when they get vaccinated. The number of smallpox cases started increasing in 1900, with the cases being 21,064. The highest it got was in 1920 with 110,672 cases and from there on it started to decline until it finally reached zero in 1952.
Polio Deaths
The polio cases have decreased by 99% since 1988, from an estimated 350,000 cases in more than 125 endemic countries to 33 reported cases in 2018. Out of the three poliovirus strains, type 2 was eradicated in 1999, and no new case of type 3 wild poliovirus was discovered. The last reported case was in Nigeria in November 2012.
Tetanus Infection
Tetanus is a bacterial infection that causes painful muscle contraction, which usually begins in the jaw and spreads to the rest of the body. The good news is that it can be recovered with the help of the tetanus vaccine, but people who recover from this virus do not always have a natural immunity to it and can get infected again.
Due to the invention of the vaccine, the number of reported cases of tetanus in the United States has decreased drastically since the 1980s. The graph shows clearly how big of a change it has brought from 1980 (95) to 2018 (0).
Conclusion
As proven from the charts above, the development and enhancement of vaccines have managed to cure the diseases and prevented countless lives from dying from an infectious and fatal disease. If you’re not vaccinated yet against any disease, we suggest that you quickly get your shots so that the antibodies can help create immunity to those diseases.
For detailed information about vaccines, click here.