If you ever watched the popular 1980s television show called The Cosby Show or the more recent cartoon show, Family Guy, you would be able to notice that they both depict traditional families. This family structure typically consists of a man, woman, and their biological or adopted children. In most traditional families, the man and the woman are known to be husband and wife.
However, over the past 40 years, the percentage of traditional families in the United States has steadily declined. According to the U.S Census Bureau, during the 1970s, traditional families accounted for 40% of U.S households, and by 1990 the percentage of conventional families declined to 25.6%. In 2010, only 20% percent of all U.S households were traditional families.
Today, there is no consistent definition of the American family because there are varying family structures, single-parent households, and fewer children. The modern family breaks categorization, which is why there is something that we now call the non-traditional family. This is a term used to describe all other types of families that are not traditional such as co-habitation families, same-sex families, extended families, and single-parent families.
In this article, we are going to learn more about the changing size of the American household and get to know how and why it changed over the years.
The Pre-20th Century American Family
When the United States of America was founded, a family was defined as a husband, wife, biological children, as well as extended family. This means that back then if you could legally marry someone, you would stay married to that person until death. Back in the 19th and early 20th centuries, most people married to move social class or to gain property rights. However, all of that somehow changed in the 1900s when people started to marry for love and romance. Divorce was rare back then because the process was costly, and the judge would never accept it unless it was the last resort. During those times, if the couple was not happy in their marriage, they would quietly separate responsibly and maturely. Still, they would remain legally married, and they could never marry someone else unless their spouse passed away.[1] This family structure became dominant, which is why it played an essential role in creating and replicating the men’s and women’s cultural roles in society. That is why back then, people saw that the part of wives was to assist their husbands within the home, such as raising the children and keeping the house.
Back then, marriage also had a condition called coverture wherein wives did not have their own legal identity because they were treated as one entity. This meant that the wife’s individual legal existence was not valid as far as property rights and other rights were concerned. [2] On the other hand, the husband’s role was to manage and provide for the family. They also controlled the finances and had ultimate authority in the eyes of the law and society. This meant that the husband could not give his wife anything such as property, and he also couldn’t make any legal agreements with his wife after marriage because it was like gifting or making a contract with one’s self.
It was also against the law to have children or live together if you were not married. But, by the 19th century, coverture became less of an issue, and rigid boundaries were relaxed as common-law marriage became widely recognized as an acceptable union between two people.
The American Family Through the Years
Early 20th Century – The Married Women’s Property Act was passed, and married women were granted property rights. During this time, most states also permitted women to sue and be sued, own property, be involved in contracts, and arrange where their property was going to end up upon her death. But even after all these changes, the woman’s primary role in the family was still defined by her husband.
The U.S. government also passed laws that regulated some aspects of childhood, such as schooling and child labor. They made school compulsory, developed playgrounds, and passed child labor restriction laws. These changes made the concept of family as the source of satisfaction and happiness even more important. During this time, new ideas about marriage, such as marrying for romantic love, companionship, and choice, emerged. In turn, it caused the divorce rate to surge, and it even tripled between 1860 and 1910.
1929 to 1940 – The Great Depression tested the stability of American families as lower wages and unemployment forced the people to delay marriage and have children. The divorce rate also fell during the Great Depression because it was too expensive, and only a few people could afford it. By 1940, almost 2 million married couples reported that they lived apart even if they were not divorced. Some families also adjusted to the economic recession by becoming a cooperative family economy. Wives helped support the family income, and many children took part-time jobs to help their families.
When World War II began, American families once again faced new issues such as lack of schools, shortage of housing, and prolonged separation. Wives ran households and raised children alone, while some women went to work in war industries. The war affected the ideas of the typical American family as thousands of youths became latchkey children, and rates of unwed pregnancy, juvenile lawbreaking, as well as absence, rose.
The 1950s – As a result of confusion and disorder at home and abroad during the war, the 1950s created a swift shift to a new type of family life. The concept of the nuclear, All-American family was introduced during the 1950s, and it emphasized the importance of marriage and the family unit. [3] This decade saw more kids, younger marriages, as well as fewer divorces. But, the perfect image often portrayed on television does not tell the whole story because apparently, only 60 percent of children grew up in a household where there was a male breadwinner and a female homemaker. The economic boom after World War II resulted in significant economic growth, especially in manufacturing and consumer goods. Families started to move to the suburbs simply because they could afford to, and for those who experienced the devastations of wartime, the family became an alternative world of intimacy and satisfaction.
The ’50s is when the concept of a close-knit family originates. The American youth highlighted family containment as a way of life who wanted to have the same long-lasting and strong relationships that their parents had. The family structure during the ’50s was mainly based on having a secure life. The global and economic instability during the early 20th century resulted in the need for closely defined families.
The 1960s – Present – As we mentioned, the ’50s defined the American nuclear family as an economically stable family unit. However, the idea of patriarchal, middle-class, and child-centered families was short-lived. Most of the changes that led to the modern family unit directly result from the women’s role in society, more specifically in the workplace and education. [4] As the post-industrial economy rose, married women started to enter the workplace. That is why during the early 1960s, about a third of middle-class women had either full-time or part-time jobs. Since then, families have become less stable, smaller, and more diverse. Adults, whether young or old, started to live outside of the family, too. This is why today, only a small percentage of American households represent the male-breadwinner, female-housewife setup.
In 2008, about 50 percent of the paid labor force were women which put them on equal standing with men when it came to working outside the house. [4] Families created through remarriage, single-parent families, as well as empty-nest families all became part of the norm. In addition, there was also a decline in birth and marriage rates and a rising divorce rate. Along with that, the percentage of cohabiting couples increased from half a million in 1960 to 4.9 million in 2000. In 2007, about 40 percent of children were born to adult, unmarried mothers. This was because people started thinking of marriage as an event that should happen after finishing college or having a stable income.
The expansion of rights that were granted to same-sex couples also reimagined the idea of the American family. With the decline of impediments to gay and lesbian unions and the increase in legal protections, people who belonged to the LGBTQ community started living openly. The United States of America legalized gay marriage in 2015. The American family became religiously, racially, ethnically, and stylistically diverse. But it does not mean that the family is a dying institution because 90 percent of Americans still choose to marry and have children.
Different Family Structures in the United States
Nuclear Family Structure
– A nuclear family is the most common type of family structure.[5] It includes a biological mother and father that are living together and raising their children. Some nuclear families may have adopted or fostered children. This type of family structure has long been upheld as the standard for raising children, even if some research shows that other family structures can be just as successful and healthy.
Single-Parent Family Structure
– Single-parent families are on the rise in the United States. It becomes common for a single parent to raise biological, adopted, or foster children without any other parent present in the family.[5] In most single-parent family cases, single parents are mothers, but there are also a number of single fathers raising their children in the U.S. Even if there are a lot of potential difficulties when it comes to being a single-parent such as financial and emotional support, this set-up is becoming more common for people, especially women.
Same-Sex Family Structure
– Just like the single-parent family structure, the same-sex family structure is becoming more common in recent years. This structure means that either two mothers or two fathers raise children. In most cases, the children are biologically related to one parent or adopted. Since same-sex marriage became legal in the United States in 2015, same-sex families have become more common.
Extended Family Structure
– Extended families are a type of family structure that can come in different ways. Parents and other family members also raise this type of family structure wherein children have the benefit of more than their mom and dad being around. In most extended families, the parents are often present, but other family members such as uncles, aunts, grandparents, and cousins. There is no single structure for an extended family because one family might consist of parents, their children and their grandparents, or children, aunts and uncles, older cousins, and grandparents, but no parents.
Step-Family Structure
– Also known as mixed or blended families, step-families are also another family structure that’s becoming more popular in the United States.[5] This type of family structure is often formed when two people, or at least one of them, have children from a previous relationship, live together, or marry. The children who became part of the blended family become step-siblings, and the adults become step-parents to their non-biological children.
Grandparent Family Structure
– This is a family structure where the children are raised by their grandparents rather than their parents. The grandparent family structure is usually formed when parents are not capable of caring for their children for a variety of reasons.
Childless Family Structure
– This kind of family structure is when the couple either cannot or chooses not to have children.[5] The childless family structure is often considered the forgotten family because it is not the traditional standard set by society. Childless families are composed of two partners working and living together.
The American Family by the Numbers
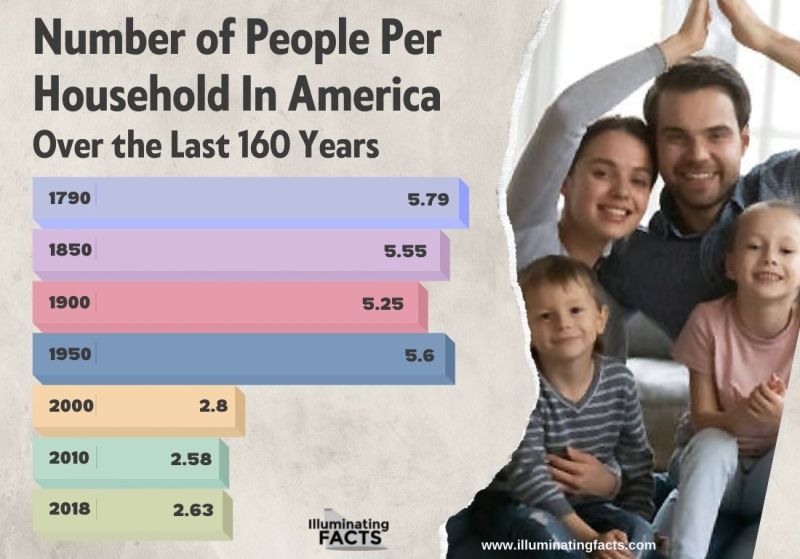
Throughout the United States’ history, there has been a slight and steady decrease in the size of the average American household. In 1790 the average number of people per household was 5.79, and it was down to 2.58 in 2010. However, this decade will likely break this long-running trend that started in 1850 because, according to the census bureau data in 2018, there are about 2.63 people per household. [6]
Mathematically speaking, households are increasing in size because the growth in the number of families is training population growth. Because according to the data that the Census Bureau released in 2018, they indicate that the population residing in a household has gone about 6% since 2010, while the number of families has grown a bit slower, from 116.7 million in 2010 to 121.5 million in 2018.
The long-running decrease in American households can be related to at least two demographic trends. The first one is the size of immediate families has declined as women choose to have fewer children. Back in 1790, the fertility rate of women was 7.0 births, which means, on average, a woman had seven births in her lifetime. This fell to 4.6 births by 1870, and by 1940, it steadily stood at 2.2.[6]
Aside from this, the upswing of the nuclear family set-up resulted in fewer extended family living arrangements as well as smaller households. Back in 1850, about 70% of people ages 65 and older lived with their adult children and their own family. By 2000, only about 15% did so. These demographic changes may result from fundamental societal changes like urbanization, industrialization, rising living standards, and limited immigration during the first half of the 1900s. [6]
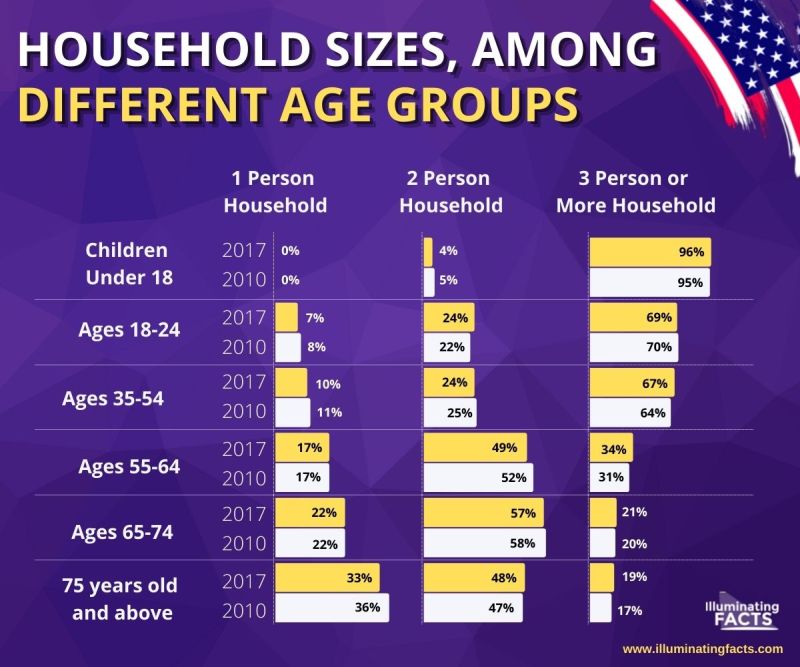
Furthermore, as a result of the Great Recession, more Americans doubled up in shared living quarters. This arrangement often refers to the presence of another adult in the household who might be the parent of the householder, an adult, or simply a boarder or roommate in the family. Since 2010, most age groups have chosen to live in larger households, which is more apparent for adults ages 35 and older. In 2017, about 67% of 35-to-54-year-olds lived in a home with three or more people.
While experts see that bigger households may be bad for the broader economy, they are often beneficial for the family themselves. This is because additional family members living under one roof may be working adults who can contribute to household income. One good example of this arrangement is young adults residing with their parents and contributing to the economic benefits of having bigger households.
The Shift from Family to Non-family Households
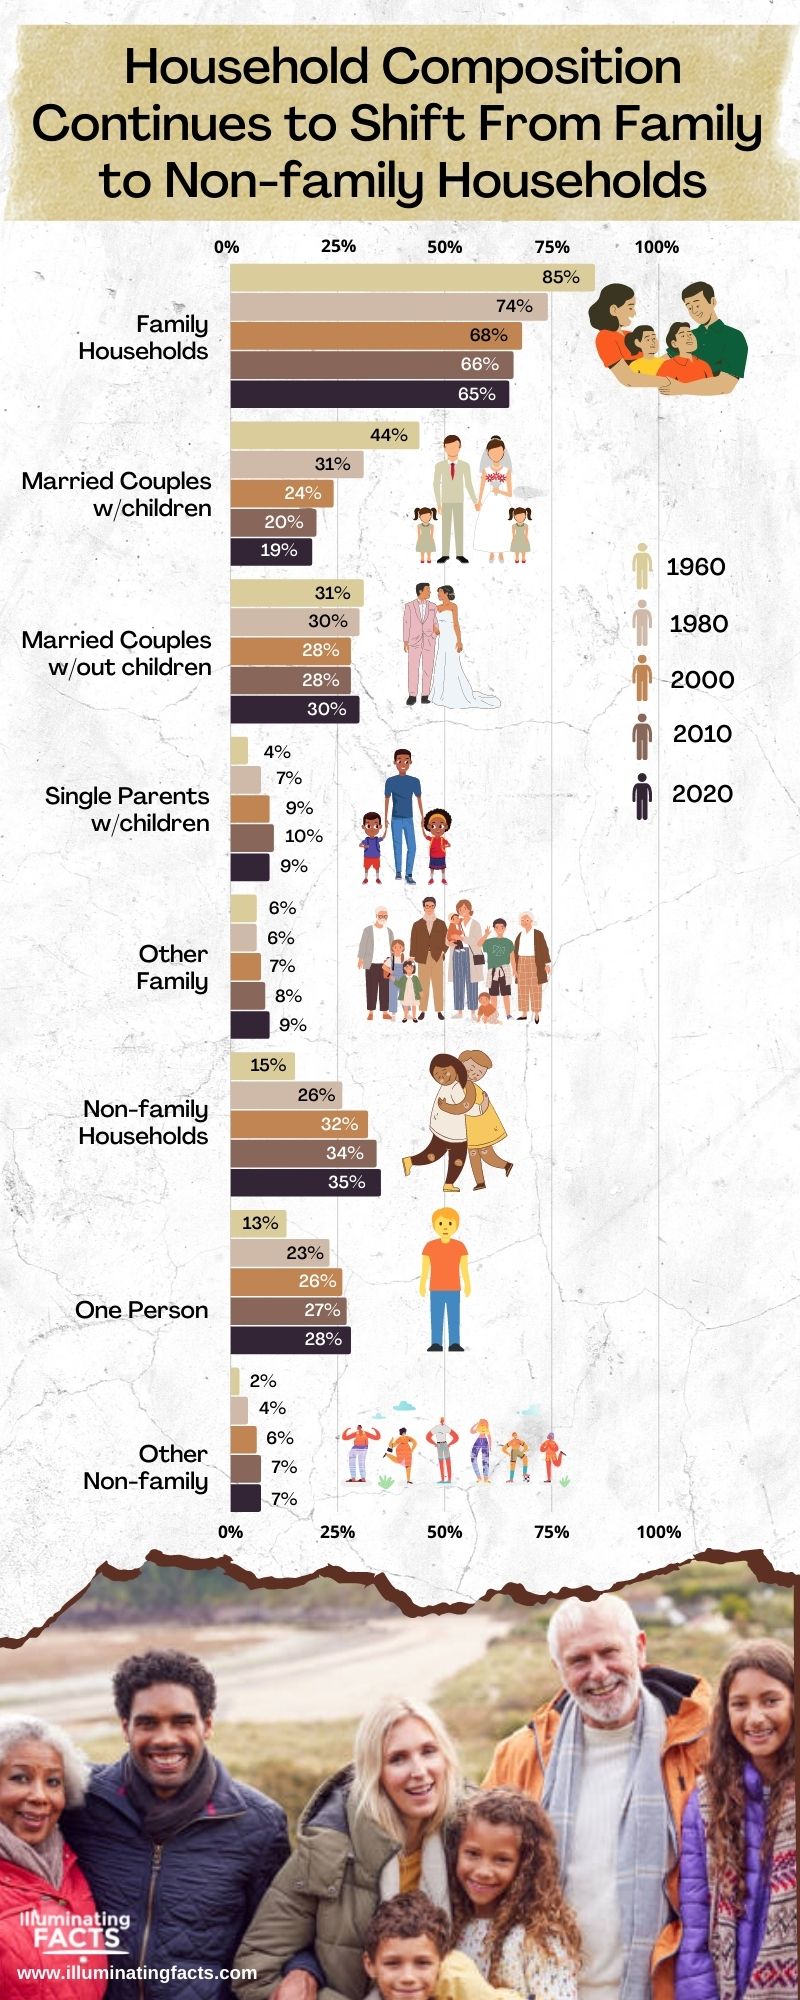
Over the last five decades, the shifts in the U.S. household composition have been remarkable, and this is because the share of a family household has declined and the allocation of non-family homes increased. Back in 1960, almost 85% of all homes consisted of families. However, by 2017, this percentage has dropped to 65%. Not only that, the types of homes in the family and non-family categories also shifted, with a coherent decline of married couples with children and a consistent increase of people living alone. [7] With that being said, the percentage of single-parent families and other non-family households has more than doubled since 1960.
Family and Household Type Across Age Groups in the United States
Household arrangement in the United States differs among householders in different age groups end. It also reflects the sequence of life stages a personal experience as they age from moving out to forming a family on their own to retirement.[7] These kinds of changes in the share of householders in different age groups significantly contributed to the ships in household arrangements in the United States.
According to studies, most young adults in the United States live with roommates. In 2017, about 61% of households are headed by an adult under the age of 25 were non-family households, 39% were family households, and 33% of householders were under the age of 25 living with roommates or cohabiting with partners, and then add 28% live by themselves. On top of this, only a tiny share we’re headed by married couples with or without children. [7]
Fewer Young Adults are Starting Their Own Families
Young adults starting new and independent households alone, with a spouse, partner, or unrelated roommates, has been a vital factor when it comes to the overall household growth rate. From 2010 to 2017, young adults ages 18 to 24 increased by 4.2 million, which accounted for about a quarter of the growth in the adult population. However, the growth rate of households in the United States slowed down to 3 percent during the same period, and the recent changes in young adults’ lifestyles and living arrangements help explain this decline.
Delays in childbearing and marriage and increases in cohabitation in young adults also contributed to the decline of family households in the United States. Since 2010, birth rates among women under the age of 30 have continued to decline. From 2000 to 2010, there has also been an increase in cohabiting couples with children. This contributed to the growth of single-parent families as well as other non-family households. However, from 2010 to 2017, the share of single-parent families decreased slightly from 10 percent to 9 percent. This decline can also be caused by young couples with children choosing to live with their parents rather than in their own homes. This explains why in 2017, the census bureau saw an increase in multigenerational households. [8]
The Great Recession also contributed to the declining shares of young adults forming and maintaining independent households. The high relative housing costs, slow economic recovery, as well as high student debts, scared the young adults from starting their own families. [7] If housing costs continue to rise, it can result in an economic burden on young adults, which can counteract any improvements in earnings and employment and dampen domestic growth rates in the future. [8]
Children Living in Two Parents vs. Single Parent Homes
According to a study done by the Census Bureau of the United States in 2016, 69% of the 73.7 million children who were under the age of eighteen lived in households with two parents. This is compared to other kinds of living arrangements such as having a single parent or living with grandparents. On the other hand, about 23% of those 73.7 million children were living with a single mother.
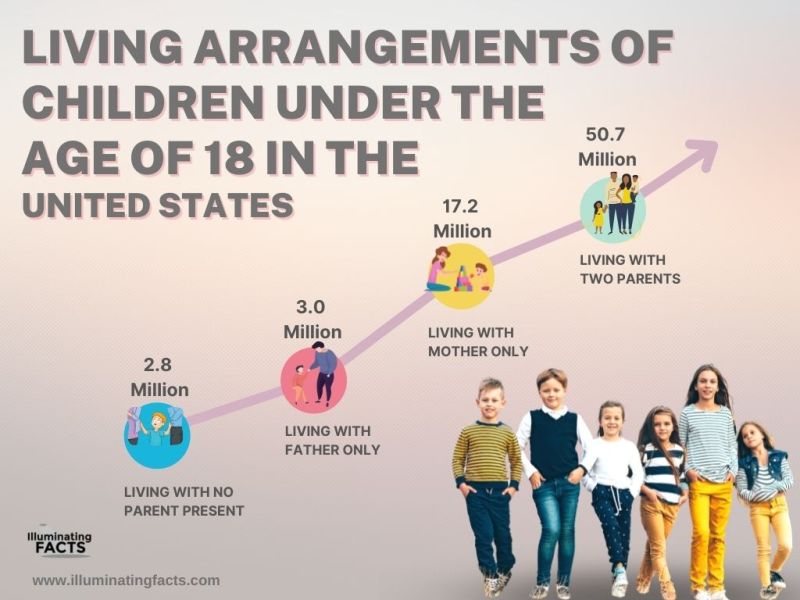
From 1960 to 2016, the percentage of children living in families with two parents has gone down from 88% to 69%. 50.7 million of those children belong to families with two parents, while 47.7 million live with two married parents, and the remaining 3.0 million live with two unmarried parents. [10]
During this period, the percentage of children living with only their mother increased from 8% to a whopping 23%, while children living only with their father slightly increased from 1% to 4%. Lastly, the percentage of children that are not living with any parent slightly went up from 3% to 4%.
How Many Households Own or Rent a House in the United States
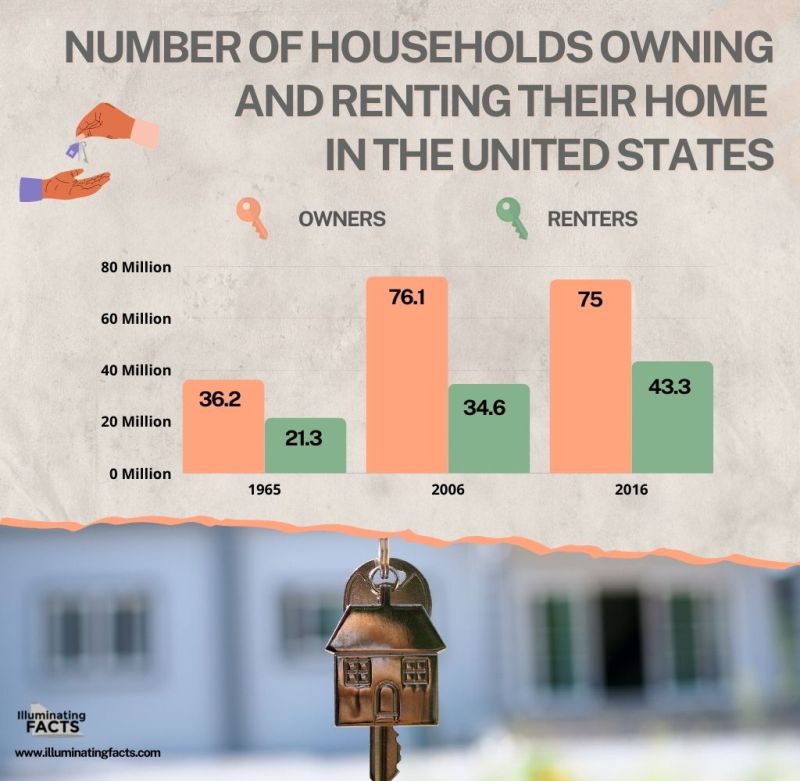
Since 1965, more U.S households are being headed by renters, according to the Census Bureau housing data analysis in 2016. From 2006 to 2016, the total number of households in the United States grew by a whopping 7.6million. However, over the same period, households that owners head remained slightly the same. On the other hand, the number of families who are renting their homes saw a significant increase during this period, from 31.2% in 2006 to 36.6% in 2016. Certain demographic groups like young adults and the lesser educated have historically been renters rather than owners, and from 2006 to 2016, rental rates among these groups increased. [11] However, during the same period, rental rates have also increased among groups that have been less likely to rent, such as middle-aged adults and whites.
Number of Households in the U.S. by Ethnic Group
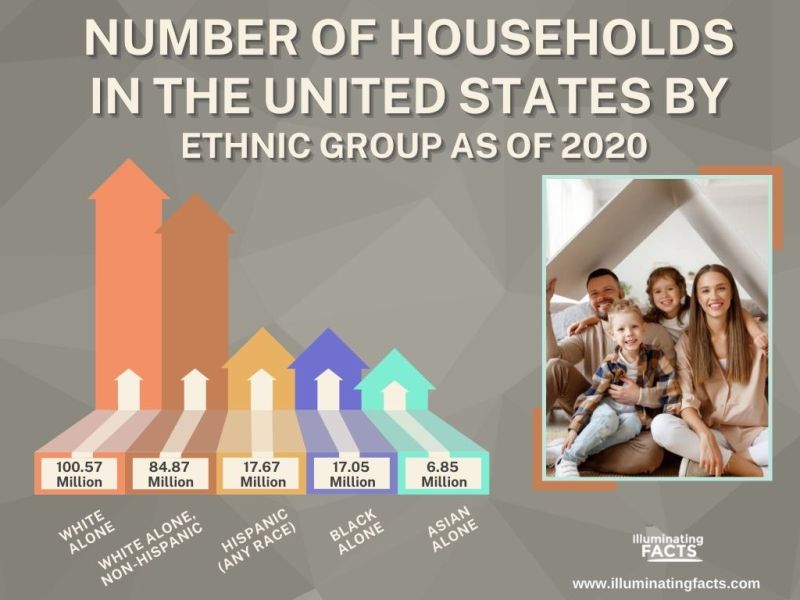
As of 2020, there are 100 million households that are led by white people alone, while there are 84.87 million households that are white-alone and non-Hispanic. 17.67 million households are Hispanic, 17.05 million are Black households, and 6.85 million are Asian households.
Interesting Facts About the Modern American Family
- Despite having several types of families, married-biological-parents families are still the norm in the United States. About 62% of children in American live with their two biological parents, and most of them are being raised by married parents.
- The marriage rate in America dropped by about three marriages per 1,000 of the population over the last 30 years. [9]
- Nevada is the only state in the U.S where you can get a marriage license and get married on the same day.
- The American family today is more blended and differently constructed. About 44% of young people ages 18 to 29 have a step-sibling. [9]
- About one-fifth of gay male households and one-third of lesbian families in the United States have children. [9]
- Over the past decades, the percentage of same-sex households grew significantly in ten states, namely Connecticut, Louisiana, Vermont, Massachusetts, Nebraska, Indiana, Montana, Delaware, Illinois, and Nevada.
- In 2011, unmarried women accounted for 41% of births in the United States.
- Intermarriage among people of different races became increasingly common in the United States. Back in 1980, only 7% of all marriages in the United States were between two people of different ethnicities or races.
- Today, the average American woman is expected to have at least 1.91 children. It is significantly low compared to the total fertility rate in 1960, which was 3.7 childbirth for every woman.
- There are about 62 million married couples in the United States as of 2019. Nevada is the state with the highest marriage rate. [9]
- Because of substantial student debts and the high cost of living, most young adults in America today are deciding to put off getting married and starting a family. [9]
- From food, diapers, milk, to daycare and beyond, it is getting more expensive to start and raise a family in the United States. Keeping up with daily spending and saving money makes retirement harder.
References:
- Quinn, S. (2021, April 6). The American divorce colonies of the 1800’s. HistoryCollection.com. Retrieved October 19, 2021, from https://historycollection.com/the-american-divorce-colonies-of-the-1800s/.
- Lewis, J. J. (2019, February 25). Coverture and women’s legal loss of existence with marriage. ThoughtCo. Retrieved October 21, 2021, from https://www.thoughtco.com/coverture-in-english-american-law-3529483.
- Business Insider. (n.d.). How the divorce rate has changed over the last 150 years. Business Insider. Retrieved October 21, 2021, from http://static7.businessinsider.com/divorce-rate-changes-over-time-2019-1.
- The evolution of American Family Structure. Concordia University, St. Paul Online. (2015, June 23). Retrieved October 21, 2021, from https://online.csp.edu/blog/family-science/the-evolution-of-american-family-structure/.
- Blessing, M. (n.d.). Types of family structures. LoveToKnow. Retrieved October 21, 2021, from https://family.lovetoknow.com/about-family-values/types-family-structures.
- U.S. household composition shifts as the population grows older; more young adults live with parents. PRB. (n.d.). Retrieved November 2, 2021, from https://www.prb.org/resources/u-s-household-composition-shifts-as-the-population-grows-older-more-young-adults-live-with-parents/.
- Norton, E. H. (2017, July 20). Family facts and figures. UUA.org. Retrieved November 2, 2021, from https://www.uua.org/re/tapestry/youth/families/workshop7/family-facts.
- The number of people in the average U.S. household is going up for the first time in over 160 years. The Pew Charitable Trusts. (n.d.). Retrieved November 2, 2021, from https://www.pewtrusts.org/trust/archive/winter-2020/the-number-of-people-in-the-average-us-household-is-going-up-for-the-first-time-in-over-160-years.
- Krogstad, J. M. (2020, July 31). 5 facts about the modern American family. Pew Research Center. Retrieved November 2, 2021, from https://www.pewresearch.org/fact-tank/2014/04/30/5-facts-about-the-modern-american-family/.
- Bureau, U. S. C. (2021, October 8). The majority of children live with two parents, Census Bureau reports. Census.gov. Retrieved November 10, 2021, from https://www.census.gov/newsroom/press-releases/2016/cb16-192.html.
- https://www.pewresearch.org/fact-tank/2017/07/19/more-u-s-households-are-renting-than-at-any-point-in-50-years/


