Background
A population refers to the number of people inhabiting a particular place e.g., town, city, region, country, or the world. Governments primarily carry out censuses to determine the number of people in a particular place. This number, then, is called a population.
The world population has a long history, to say the least. It stretches back two million years ago (mind-bogglingly long) as per anthropologists when humans first appeared on Earth, long before the modern humans named Homo Sapiens appeared. That is fascinating history to cover, but don’t worry. This post will give an overview of the world population’s history and won’t bore you to death.
The world population has seen exponential growth but also fluctuations. Recently, we have seen a population boom due to many factors affecting fertility and external factors. We will assess whether this population boom is bad for the planet and evaluate the notion that the world will be overpopulated in the next fifty years.
Populations are dispersed differently depending on the regions, and there are many reasons why particular regions are more populated than others which we will cover in this post, including population density, the top countries in terms of population, and population density. The world’s population is also comprised of people of various races & ethnicities, languages, religions, and backgrounds. This post will also discuss the demographics and composition of the world’s population.

Crowd of people in London

Wooden men in different colors

A paper with charts and a calculator

Dense apartment building in Hong Kong
Although boring and hard to understand, we will shed light (just a little bit) on the mathematics behind the growth of the world population. This section is going to be purely dedicated to the nerds out there. But we will also provide easy-to-understand rationale and the gist behind the mathematics so that people like us can also grasp it.
The post will also go over some not-so-positive sections. We will discuss at length mortality, including mortality among elderlies, infanticide, infant mortality, and epidemiologic transition. After this not-so-positive section, the section will discuss a very interesting part where we will see what different anthropologists say about the world population i.e., population theories.
Yes, we know this might be a little bit too overwhelming. But after reading this, we assure you that you will know much more about yourself and your ancestors and come out much more informed. So, let’s deep dive into the growth of the world population. See you on the other side!
History
Ancient History
Let’s begin with the history (warning: this might be a little boring). When agriculture became prevalent, estimates show that the world population ranged between 1 million and 15 million in 10,000 BC[1]. According to the Toba Catastrophe Theory, evidence has shown that the world population suffered a bottleneck at about 70,000 BC when the population was between 1,000 to 10,000 people, which is quite fascinating because a small town would have a population of more than 10,000 – imagine having only 10,000 people on this vast planet. However, estimates say around 50 to 60 million people lived in the eastern and western Roman Empire in the 4th century AD.
Unfortunately, there have been significant events in the past that have affected the world’s population and its growth significantly. The world population has been on a journey like that of a rollercoaster – as the world recovers from a setback, something sinister occurs again and washes away all the growth we had made, restarting everything, a sad tale surely.
Between the 6th and 8th centuries AD, the Justinian Plague wreaked havoc across Europe as it caused Europe’s population to fall by a staggering 50%. Hold on, try to process that figure; it’s just crazy. And then came The Black Death pandemic in the 14th century, another significant event that adversely impacted the world’s population; it caused the population to drop a staggering 100 million in a mere 60 years (1340 till 1400). To put that 100 million in perspective, it is more than the population of today’s Germany; quite unbelievable.
Factors other than disease also cause significant population drops; for example, China’s population dropped by 58 million between 1200 and 1393 because of the Mongolian invasions, famines, and plagues.
Quite fortunately, the Han Dynasty of China started maintaining records of families beginning in AD 2 to calculate the tax liabilities on each household because they wanted their money and were sharp with their accounting. In AD 2, Western Han’s population was (per the registers) 57,671,400 individuals, which decreased to 47,566,772 individuals by AD 146 towards the end of the Han Dynasty of China. In 1368, China’s population was estimated to be around 60 million, and by 1644, it had grown exponentially to around 150 million. In comparison, England’s population grew and was less than countries such as China. In 1500, it was around 2.6 million, and by 1650, it was around 5.6 million. China has always been a mammoth in terms of population and has remained one.
The history of world population growth was afflicted with ups and downs, where populations grow but fall significantly due to diseases (pandemics & epidemics), famine, war, and invasions. As per some claims, up to 90% of the deaths of the Native American population are attributed to diseases such as measles, smallpox, and influenza, diseases of the Old World. Thankfully, advances in health and sanitation have kept us safe from these horrible diseases.
Contemporary History
The world’s population and children’s life expectancy have sharply risen, especially during the agricultural and industrial revolutions. For instance, the death of children in London before turning five was 74.5% between 1730-1749 and 31.8% between 1810-829, a significant change of 42.7%. Even more so, the population in Europe grew exponentially, going from 100 million to 400 million between the years 1700 and 1900[2].
The factors driving such strong population growth were the betterment of healthcare, sanitation, and –perhaps one of the most important factors–the vaccine (very relevant nowadays). For instance, improvements in living conditions and medicine led to Britain’s population growing from 10 million to 90 million in the 19th century. Similarly, the United States also saw such solid growth as it grew from 5.3 million to 106 million between 1800 and 1906, which crossed over 307 million in 2010.
The Soviet Union saw large population decreases because of consecutive major wars (Soviets needed to calm down) in the first half of the 20th century, it suffered more than 60 million deaths over the period of these wars; all these 60 million people would have been alive and have had further generations, these generations would have had more offspring, this is the true cost of war. In addition, following the collapse of the Soviet Union, it has suffered a continued decline in population since 1991, when it was 150 million people strong and was 143 million in 2012. However, we have some great news, this decline has halted since 2013, and the population has started growing.
Aside from Britain, Europe, and the Soviet Union, many developing countries have seen rapid population growth due to improving economies and public health, especially in the 20th century. China grew from 430 million to 580 million between 1850 and 1953, and current statistics show that it stands at 1.3 billion, which is nothing less than colossal because it is 18.47% of the total world population. One country holds almost 20% of the entire world’s population; fascinating, isn’t it? Right next to China is the Indian subcontinent consisting of India, Pakistan, Bangladesh, Nepal, Sri Lanka, Bhutan, and the Maldives, which has grown from 125 million to 389 million between 1750 and 1941. In 2021, India, Pakistan, and Bangladesh will be home to over 1.6 billion people, which is another significant population mass concentrated in a relatively small area. The region of Asia wields great power in terms of population, do not mess with it.
African, other Asian countries, and South American countries have also seen similar population growth. For example, Indonesia grew from 5 million people in 1815 to over 140 million. In addition, Brazil’s population expanded by over 10 times between 1900 and 2000 (from 17 million to 176 million). Mexico and Kenya have also seen such monstrous growth in their populations. These growths have been linked to economic development and improvements in public health.
Billion Milestones
This section will look at the billion milestones of the world population. We have achieved these billion milestones in a non-linear fashion, more specifically in an exponential way, because nothing in life is linear. The world reached one billion in 1804, it took more than 123 years to reach two billion in 1927, but then only took 33 years to increase up to three billion in 1960. Humans are weird.
Let’s have a look at the milestones in the table below.
| Year |
Population (billions) | Duration |
| 1804 | 1 | — |
| 1927 | 2 | 123 |
| 1960 | 3 | 33 |
| 1974 | 4 | 14 |
| 1987 | 5 | 13 |
| 1999 | 6 | 12 |
| 2011 | 7 | 12 |
Population Growth since 10,000 BC
It is interesting how the population has seen an explosion; the definition of recent times is relative because we are comparing more than 1,000 years here. Let’s look at this population boom from a perspective that is zoomed out and consider more years.
Source: Lumen Learning[i]
The graph above shows that the world population remained relatively stable and low before AD 1. We can see that most of the population growth we have seen is concentrated after 1000 especially. The reasons behind this will be explored in this article in detail but generally include better living standards, improved sanitation, advances in medical and health sciences, and the growth of economies worldwide.
The population as per region
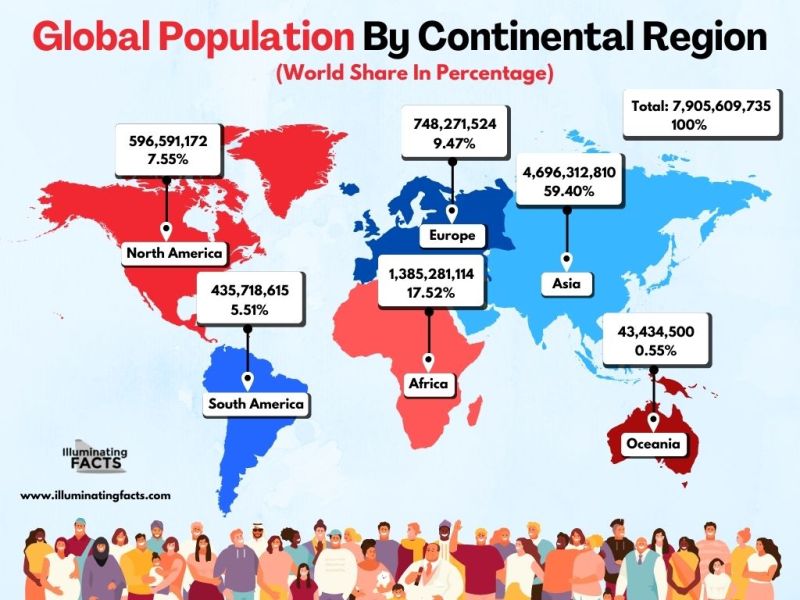
In this section of this fascinating article, we will look at the population numbers as per the regions. We define regions as the continents for the purposes of this section. As we discussed at the beginning of this article (we hope you read that part), populations worldwide are widely dispersed as our ancestors moved out from Africa to different parts of the world. Humans have reached as far as Antarctica, but the populations are primarily concentrated in the six continents of the world as the populations in Antarctica are temporary and mostly consist of research staff and some cute penguins.
Source: Worldometer [3]
In the table above, we see that Asia is the most populated continent on Earth, Africa comes second, and then Europe comes third.
Let’s look deeper into each continent’s populations, divided by sub-regions.
# | Sub-Region | Population (2020) | Yearly Change | Net Change |
1 | Southern Asia | 1,940,369,612 | 1.16% | 22,158,231 |
2 | Eastern Asia | 1,678,089,619 | 0.33% | 5,478,521 |
3 | South-Eastern Asia | 668,619,840 | 1% | 6,608,034 |
4 | Western Asia | 279,636,754 | 1.57% | 4,311,941 |
5 | Central Asia | 74,338,950 | 1.54% | 1,126,850 |
# | Sub-Region | Population (2020) | Yearly Change | Net Change |
1 | Eastern Africa | 445,405,606 | 3.% | 11,500,663 |
2 | Western Africa | 401,861,254 | 3.% | 10,421,097 |
3 | Northern Africa | 246,232,518 | 2.% | 4,451,750 |
4 | Middle Africa | 179,595,134 | 3.% | 5,286,702 |
5 | Southern Africa | 67,503,635 | 1.% | 873,740 |
# | Sub-Region | Population (2020) | Yearly Change | Net Change |
1 | Eastern Europe | 293,013,231 | 0.% | -431,682 |
2 | Western Europe | 196,146,316 | 0.32% | 623,906 |
3 | Southern Europe | 152,215,230 | 0.% | -231,693 |
4 | Northern Europe | 106,261,249 | 0.47% | 492,744 |
# | Sub-Region | Population (2020) | Yearly Change | Net Change |
1 | South America | 430,759,766 | 0.83% | 3,560,320 |
2 | Central America | 179,670,200 | 1.% | 2.083,674 |
3 | Caribbean | 43,532,365 | 0.46% | 197,380 |
# | Sub-Region | Population (2020) | Yearly Change | Net Change |
1 | United States | 331,002,651 | 0.59% | 1,937,734 |
2 | Canada | 37,742,154 | 0.89% | 331,107 |
3 | Bermuda | 62,278 | -0.4% | -283 |
4 | Greenland | 56,770 | 0.14% | 79 |
5 | Saint Pierre and Miquelon | 5,794 | -0.67% | -40 |
# | Sub-Region | Population (2020) | Yearly Change | Net Change |
1 | Australia and New Zealand | 30,322,117 | 1.% | 335,856 |
2 | Melanesia | 11,122,996 | 2.% | 204,479 |
3 | Polynesia | 683,786 | 0.59% | 4,015 |
4 | Micronesia | 548,914 | 1.% | 5,428 |
Source (all sub-region tables above): Worldometer3
Demographics & Composition
In this section of this article, we will look at the world population’s demographics and composition. We will look at the historical data on the global sex ratio, the current global sex ratio, and its projections. We will then proceed to discuss the age structure of the global population, the global life expectancy, the economy of the world, the languages, and religions. We are essentially looking at the demographics of the humans populating our dear planet, you can imagine how important this section is.
Global Sex Ratio
The global sex ratio is the ratio of males to females in the world population. It is imperative to understand that the sex ratio is not stable and depends on many biological, cultural, social, technological, and economic factors. Moreover, the global sex ratio, in turn, affects the demographics of a country, the economy, and the social fabric of a country. So we urge you to read this part carefully!
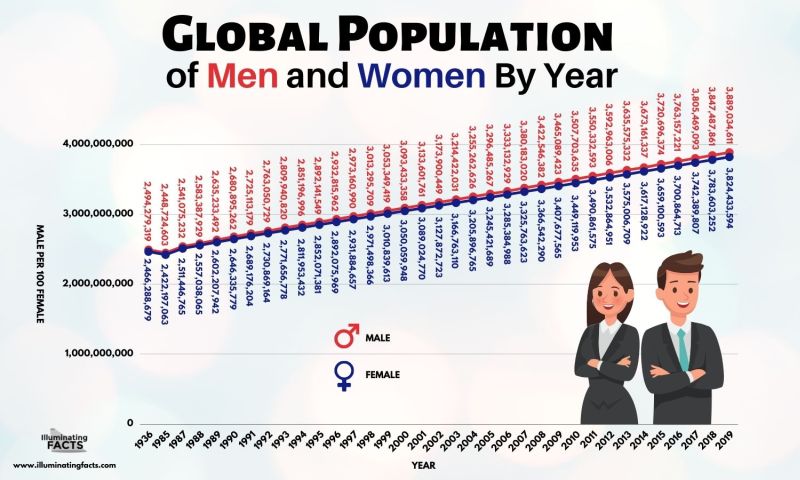
First, look at the historical data of the global sex ratio, depicting the males, females, and the male to female ratio (males per 100 females) in the table below to give us an idea about the historical averages.
Global Sex Ratio Historical Data
Source: StatisticsTime[4]
That table might have overwhelmed you, but don’t worry; it simply shows the number of males per 100 females i.e., the global sex ratio from 1985 to 2019. It shows that the global sex ratio has remained stable in the range of 101. To understand this data better, let’s look at the visualized version of this data.
Source: StatisticsTime4
The graph above is the visualized version of the table above; isn’t it better than the above? The graph above shows that over the period of 35 years, males per 100 females i.e., the global sex ratio, has steadily grown to 101.689. However, as aforementioned, it has remained within the bounds of 101; the minimum is 101.549, the maximum is 101.689, and the average ratio has been 101.675. As such, it has remained fairly stable.
Global Sex Ratio Currently
The Global Sex Ratio, as of 2021, is reported to be 101.68 males per 100 females as there are 3,970,238,390 (3.930 billion) males representing 50.42% of the global population, whereas there are 3,904,727,342 (3.905 billion) females which represent 49.58% of the global population.
Most countries in the world actually have more females than males. However, populous countries such as Pakistan, India, and China have more males than females, increasing their country-specific sex ratio. So, check out your country’s sex ratio!
Global Sex Ratio Projections
| Year | Males | Females |
M Per 100 F
|
| 2022 | 4,009,829,762 | 3,944,122,815 | 101.666 |
| 2023 | 4,043,771,753 | 3,983,028,585 | 101.651 |
| 2024 | 4,087,120,942 | 4,021,484,313 | 101.632 |
| 2025 | 4,124,919,510 | 4,059,517,943 | 101.611 |
| 2026 | 4,162,157,763 | 4,097,118,883 | 101.587 |
| 2027 | 4,198,812,392 | 4,134,265,926 | 101.561 |
| 2028 | 4,234,898,159 | 4,170,965,142 | 101.533 |
| 2029 | 4,270,434,917 | 4,207,225,806 | 101.502 |
| 2030 | 4,305,436,923 | 4,243,050,443 | 101.47 |
| 2031 | 4,339,910,399 | 4,278,438,555 | 101.437 |
| 2032 | 4,373,852,542 | 4,313,375,331 | 101.402 |
| 2033 | 4,407,252,206 | 4,347,831,306 | 101.367 |
| 2034 | 4,440,095,078 | 4,331,767,627 | 101.331 |
| 2035 | 4,472,370,475 | 4,415,153,754 | 101.296 |
| 2036 | 4,504,074,999 | 4,447,973,886 | 101.261 |
| 2037 | 4,535,212,764 | 4,430,224,352 | 101.227 |
| 2038 | 4,565,789,971 | 4,511,903,674 | 101.194 |
| 2039 | 4,595,815,916 | 4,543,012,646 | 101.162 |
| 2040 | 4,625,296,608 | 4,573,550,774 | 101.131 |
| 2041 | 4,654,233,005 | 4,603,512,471 | 101.102 |
| 2042 | 4,682,621,447 | 4,632,886,682 | 101.074 |
| 2043 | 4,710,457,158 | 4,661,661,027 | 101.047 |
| 2044 | 4,737,734,121 | 4,639,821,223 | 101.022 |
| 2045 | 4,764,446,974 | 4,717,356,293 | 100.998 |
| 2046 | 4,790,594,256 | 4,744,260,506 | 100.977 |
| 2047 | 4,316,175,164 | 4,770,532,785 | 100.957 |
| 2043 | 4,841,185,395 | 4,796,172,170 | 100.939 |
| 2049 | 4,865,620,342 | 4,821,180,003 | 100.922 |
| 2050 | 4,889,476,137 | 4,845,557,763 | 100.906 |
Source: StatisticsTime4
As with the historical data on the global sex ratio, let’s also look at the projections for the global sex ratio in a graph to understand the tabulated data better.
The global sex ratio i.e., males per 100 females, is projected to fall between 2022 and 2050 to 100.906, almost equalizing the male to female ratio. However, it is imperative to remember that while the sex ratio may decline to 100.906 globally, it is not necessary that every country will see this downward trend because each country has its own social, cultural, technological, and economic factors that impact this sex ratio. Because we are looking at the total average of the global sex ratio, so your country might have a ratio higher or lower than this.
Religions
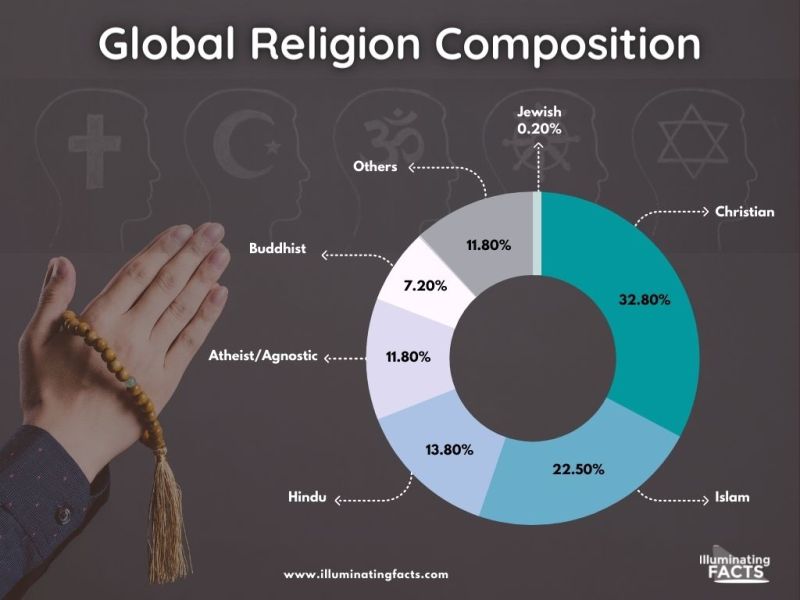
Religion plays such an important role globally that it cannot be emphasized enough. As such, we should also study the global religion composition and understand the largest and most widely practiced religions worldwide to understand what values and belief systems exist in our diverse and beautiful world.
Source: World Economic Forum [5]
From the pie chart above, it can be ascertained that Christianity, Islam, and Hinduism are the top 3 largest religions in the world.
North America primarily consists of Christians but also a significant atheist/agnostic population. Europe is also dominated by Christianity, it also has a solid atheist/agnostic population, even as much as half of the total in countries such as the Czech Republic, which is quite astonishing. India is the primary country where most of the Hindus of the world reside; therefore, it is an outlier because most Hindus are in India – let’s try to digest this fact: the top three religions are primarily based out in one country that is also one of the most populous countries in the world.
Southeast Asia and Japan are home to the Buddhist religion. However, China has the largest atheist/agnostic population globally, making it another outlier like India. Lastly, Islam is spread well throughout the world as it stretches from North Africa to the Middle East, Indonesia, and Malaysia. Although many religions are dispersed widely across the globe, certain religions have concentration hubs, such as India for Hindus, the Middle East for Muslims, and Japan for Buddhists.
Gross World Product
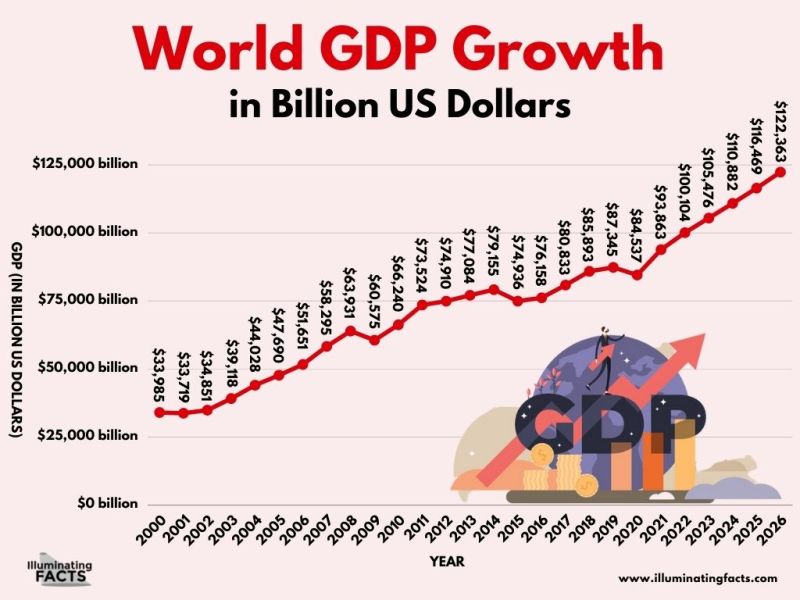
The Gross World Product (GWP) is the sum of the gross domestic product (GDP) of all the countries in the world. It provides an overview of whether the world economy has improved, the current performance of the world economy, and the direction it is heading in. GWP is all about the money. If you are into finance or learning about the world economy, this section will be fun.
Source: Statista [6]
The graph above shows the Gross World Product from the year 2000 and projections until the year 2026. It shows that the world economy has, on average, had a positive trend and has grown steadily. It can, however, be noticed that there are certain dips in the graph. The first one is the years between 2007-2009 when the global financial crisis hit countries. The second one is around 2015 when the world saw a global trade slowdown.
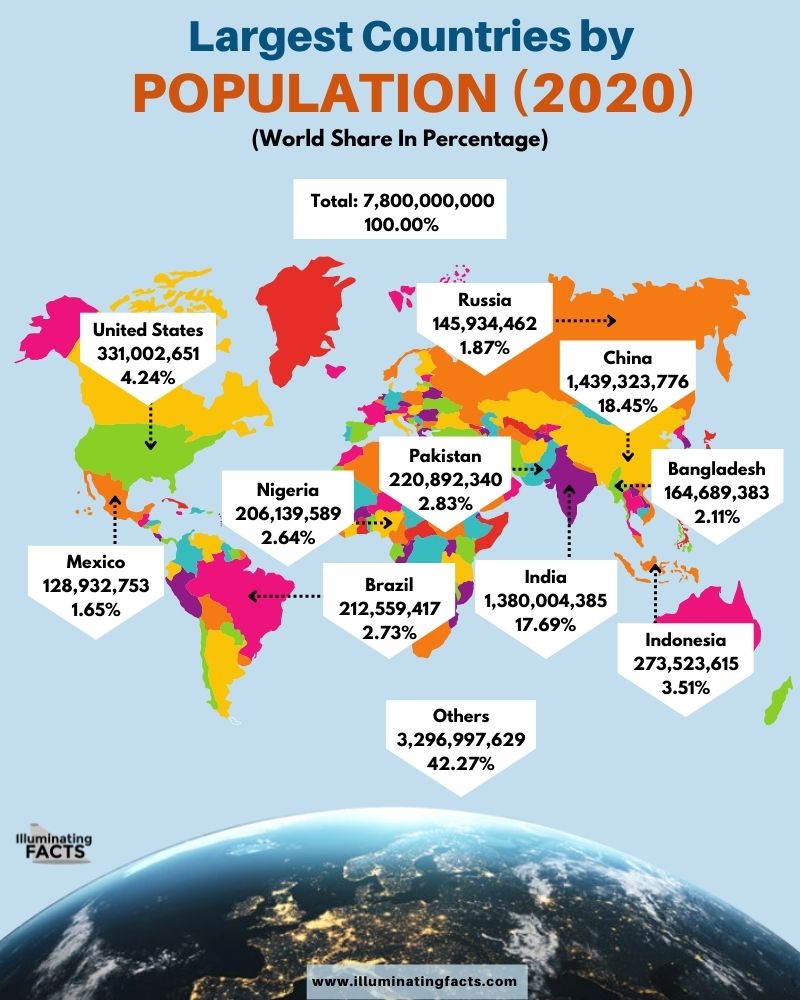
Largest Countries by Population
In this section, we will look at the countries that are the largest in the world by population. You don’t want to mess with these countries.
Source: Worldometer [7]
The table above shows the top ten largest countries by population. It shows that the three most populous countries of the world alone have more than 40% of the world’s entire population, these are China, India, and the United States. Imagine only three countries of the world hold more than 40% of the entire population. Now try to understand the business, geopolitical, and economic consequences of this.
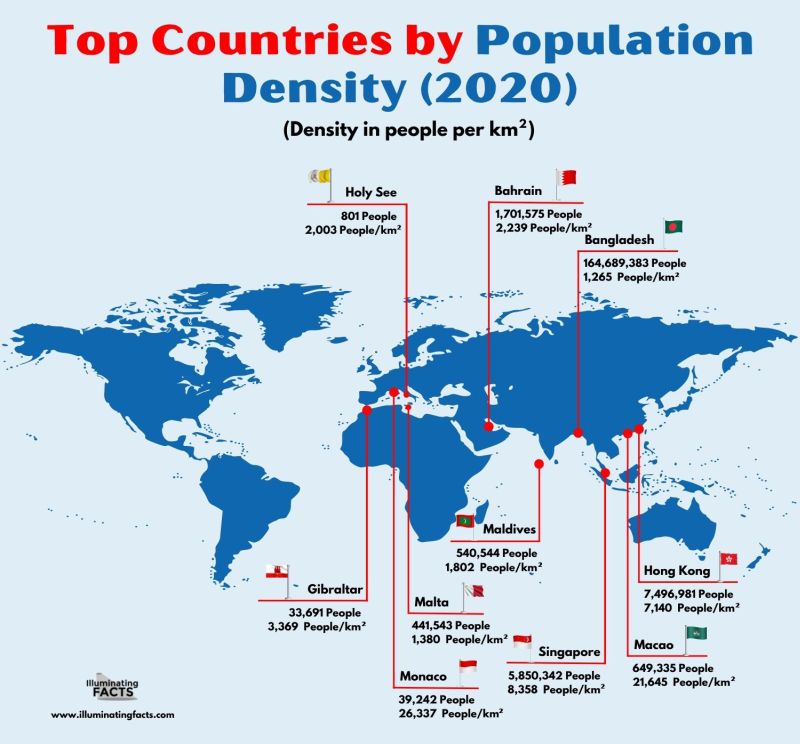
Top Countries by Population Density
Population density is a tool that calculates the number of people i.e., the population per unit area. For example, 36 people in a KM square. It is a solid indicator for measuring the quality of life in a particular area, country, or region. Therefore, it is another imperative number to analyze and look at in-depth. The higher the density, the more people in a certain area. A higher density is not a great thing to occur in a country.
Source: Worldometer7
The table above shows the top ten countries by population density. It is calculated by dividing the total population by the total land area available to a country. It reveals that Monaca is the densest country in the world, and the following two countries are Macau and Singapore. This means that there are 26,337 people living in an area of kilometers squared in Monaco! Imagine how packed it must be.
There are many advantages and disadvantages of having a high population density. Beginning with the disadvantages, as mentioned above, the high population density will reduce the quality of life as it will compromise green spaces by replacing them with roads, buildings, and infrastructure. Moreover, it may also lead to poor long-term health due to substandard quality of life, which may result in high health-related costs. Lastly, higher population density pushes the members of society to degrade environmental resources and deplete them rapidly.
On the flip side, the advantages of a high population density are that it reduces the overall average transport network costs. Moreover, because of a lack of space pushes people to innovate and bring up new ideas to maximize the return from the limited resources, thus resulting in efficient use of resources. And lastly, it also drives good economic growth because of the innovation and the need to be efficient.
Population Growth Rates
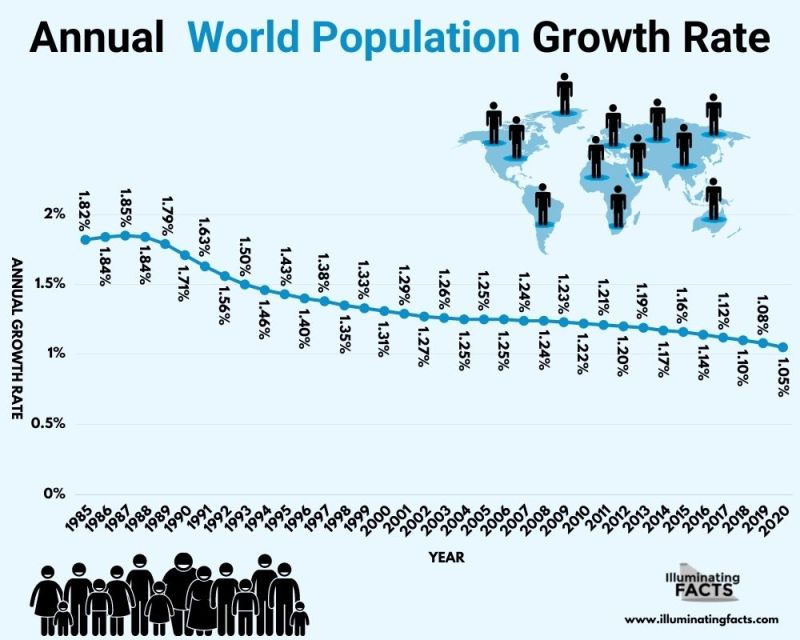
The population growth rate is the rate of natural increase in population and the net migration effects. In simpler words, it is the rate at which the number of people in a particular region increases. Population growth rates are indispensable tools for a country due to their high utility. This includes forecasting infrastructure needs, food needs, and many other planning stages of governments and businesses incorporating the population growth rates.
Source: Worldometer3
The data in the table above is visualized and illustrated in the graph below for better understanding.
Source: Worldometer3
It can be deduced from the graph and the tabulated data above that over the period between 1985 and 2020, the annual growth rate of the world population has steadily declined to reach just over 1% in 2020. This means that although the population is growing but at a slower rate than in 1985. This is in line with the global phenomenon of people having children later in life or choosing not to have children at all, this is more applicable in developed countries such as Japan, South Korea, and Italy.
Mathematics
And comes the dreaded section but worry not, we will explain everything, and trust us, these equations help us to forecast population growth and allocate resources accordingly. Different mathematicians have proposed equations that model the population growth in certain periods. It is important to remember that the world population will not grow infinitely forever and will have a point of a zero slope and then a point of inflection. This means that there will be a time when the population growth will stop, and then the population will most likely decline, leading to the growth rate being negative.
In 1975, German astronomer Sebastian von Hoerner introduced the world to a hyperbolic growth formula for population growth with an infinite population in 2025. This was observed until the 1970s and correlated with second-order positive feedback.
Russian physicist Sergey Kapitsa proposed a formula that calculated how the world population grew between 67,000 BC and 1965 [8]. The formula is:
However, it is pertinent to note that no equation can accurately capture the world’s population growth and can only provide approximations.
Fertility
Fertility is a super important topic to discuss in this article, so read carefully. Fertility is defined as the ability to conceive children. Before discussing fertility and the factors affecting fertility, we should know the difference between fecundity i.e., the biological potential for reproduction, and fertility i.e., the actual reproduction level.
The gap between the two can arise due to many different factors, one of which is that most women do not begin to reproduce immediately after puberty, which is also not at a fixed age. Secondly, it is unnecessary for every woman with the biological potential to reproduce because they do not want to have kids. Thirdly, some women do not engage in reproductive activities, for example, becoming widowed and not remarrying. Fourthly, social behavior and norms reduce fertility. Lastly, many couples purposely restrict their fertility by using contraception, abortion, sterilization, and abstinence from sex.
Before moving on to the factors affecting fertility, let’s shed some light on how fertility rates affect population growth – after all, we are discussing population growth. A fertility rate indicates the average number of children a woman would conceive over her lifetime. A high fertility rate means a woman would have, on average, a high number of children during her lifetime. This means that the population growth rate would likely also be high and thus rapidly growing. However, a high fertility rate is subjective, and so is the growth rate. Nevertheless, this widespread phenomenon exists in many developing countries such as Pakistan and Bangladesh.
Factors affecting fertility
Since reproduction is fundamentally a biological process, we should first consider the biological factors affecting fertility.
The age at which potential fertility onsets, the degree of fecundability which is the probability of conceiving monthly where no contraception exists, the incidence of abortion and stillbirth, and lastly, the age at which permanent sterility onsets.
Apart from these biological factors, three non-biological factors affect fertility: contraception, abortion, and sterilization.
Contraception reduces the probability of conceiving; therefore, it adversely affects fertility. Contraception has developed over the years with many new innovations with varying degrees of effectiveness e.g., condoms, birth control pills, and diaphragms. The effects of contraception are found to be significant on fertility.
Abortion, in this case, refers to induced abortion where the pregnancy is terminated rather than affecting the fecundability. Abortion is nothing new as it has been practiced for a very long in our society and is common in many societies.
Sterilization refers to the complete elimination of fecundability. Different surgical procedures, such as vasectomy or tubal ligation, are undertaken to achieve sterilization. Many couples do it on a voluntary basis to eliminate the chances of conceiving; in fact, it has become one of the most common ways to discontinue fertility when the couples have reached the desired number of children in the family in the United States.
Mortality
As we warned you at the beginning of this article, we will have some not-so-positive discussions. This is that not-so-positive part of the post, but it is important that we discuss it as it plays an important role in the world’s population growth. Mortality is defined as death on a widespread scale. The mortality rate is the number of deaths in a particular region per unit. Like fertility and birth date, the mortality rate is another crucial measurement tool and fundamental to populations and their growth.
Although mortality may vary significantly on an individual basis, when aggregated, a regularity emerges, which shows the average life expectancy at birth which is also a life-table measure used by many companies such as life insurance companies to calculate premiums.
Even more important than that, mortality rates and life expectancy play a chief role in the growth of the world population. As a rise in fertility and birth rate increases a population rapidly, a rise in mortality rate also decreases a population. The net effect between the two is the natural population growth.
Life expectancy has improved significantly, especially since the age of enlightenment. This is because sanitation and health services have gradually improved. Remember that most mortalities were from newborns or children before age five, as half of the children died before adulthood. So, therefore, with better health and sanitation, the mortality rate decreased, and thus life expectancy increased, spurring further population growth.
Life expectancy doubled in all world regions between the 1730s and 2019 for many reasons, a few mentioned above. Diseases used to spread, but there were no effective public health measures or effective medicines. However, since health has improved, we have seen—expectedly—increasing population growth which epidemiologists call “health transition.” Thank God we live in times when life expectancy is significantly high. Life must have been tough back then, dying so young.
Source: Our World in Data [9]
It can be seen in the graph how the life expectancy of the continents across the world and the world have risen very sharply after the 1900s and continue to grow; in fact, the world life expectancy grew from an average of 29 to 73 years in 2019. However, it can be noticed that Oceania, Europe, and the Americas are the top three regarding life expectancy, whereas Asia is at the bottom with Asia being in the middle of the two. Higher life expectancy means higher total populations if all else remains constant.
Should We Worry About Overpopulation?
This is the million-dollar question that everyone has their own, but it is a very genuine question that leaves many wondering if we are heading straight towards doom as humans will continue to have babies infinitely without any stop, which will continue to worsen the situation for climate change. But let’s not get ahead of ourselves and slow down to analyze what’s happening, shall we?
Let us give you the short answer to the question: no. This is because, well, simply, the problem of overpopulation is just overstated. Secondly, overpopulation is one of the least influential factors in climate change.
Thirdly, we are seeing a phenomenon in many developing, and developed countries, specifically that population growth is starting to become stagnant and falling to the point that some countries are facing an inverted population structure pyramid. This means that the proportion of the population is increasing because of rising life expectancy, while the proportion of young members is decreasing because of falling birth rates as couples increasingly delay having children, have limited children, or have none. In fact, in Japan, adult diapers are more sales than children’s diapers. This is a very interesting phenomenon.
Therefore, you should not worry about overpopulation because we will soon reach a plateau point in many countries, leading the global population to stabilize around a certain figure. Moreover, since technology has allowed innovative ways to produce efficient food, the technology will also be advanced enough to do so at that time. So, let’s all calm each other down and focus on many other issues causing climate change and tackle it together as a team.
Future Forecasts and Projections
The United Nations (UN) projections for the world population growth show it declining to .1% by 2100. [10] If this trend continues, the world will see the “peak” population at around 10.88 billion, with the potential for a declining population after that.
20 Interesting Facts About the World Population
- India will become the most populous country in the world by 2024, overtaking China.
- Out of the top 10 most populous countries in the world, Nigeria has the fastest-growing population in the world.
- 3 countries account for 40% of the entire world’s population.
- The overall fertility rate is declining. In fact, an estimate says that half of the men will be infertile by 2050.
- Monaca is the most densely populated country in the world.
- In Japan, more adult diapers are sold than children’s diapers.
- Life expectancy has more than doubled on average around the world since the last century.
- Niger has the largest youngest population in the world.
- Europe’s population is expected to decline as the fertility rate has fallen below recommended i.e., at 2.1
- The world’s population is becoming increasingly older as birth and death rates both fall.
- Significant migration is happening worldwide, and many Asian and African countries are seeing emigration (leaving).
- Many countries are removing the maximum child policy because of falling fertility rates, such as China.
- The last decade has had the greatest number of young people, which has significant implications for social and economic progress.
- Millions of women in developing countries still cannot use modern contraceptives to avoid pregnancy.
- By the end of this century, two estimates about the world population emerge: it could be as high as 17 million or as low as 7 million.
- More than 50% of the world’s population now lives in an urban area.
- Africa is the most ruralized continent on Earth, with 57% of the population living in rural areas.
- North America is the most urbanized continent on Earth, followed by Latin America and the Caribbean.
- The world’s most populous city is Tokyo, followed by Delhi and followed by Shanghai.
- More than 108 billion have lived on Earth, and only 7% of that are presently alive.
References
[1] Luc-Normand Tellier (2009). Urban world history: an economic and geographical perspective. p. 26. ISBN 978-2-7605-1588-8.
[2] “Modernization – Population Change”. Encyclopædia Britannica. Archived from the original on 6 April 2009. Retrieved 6 February 2013.
[3] World Population Clock: 7.9 Billion People (2021) – Worldometer. (n.d.). https://www.Worldometers.Info/. Retrieved November 25, 2021, from https://www.worldometers.info/world-population/#region
[4] World sex ratio 2021 – StatisticsTimes.com. (n.d.). Statistic Times. Retrieved November 26, 2021, from https://statisticstimes.com/demographics/world-sex-ratio.php
[5] These are all the world’s major religions in one map. (2020, February 8). World Economic Forum. Retrieved November 30, 2021, from https://www.weforum.org/agenda/2019/03/this-is-the-best-and-simplest-world-map-of-religions
[6] Statista. (2021b, July 30). Global gross domestic product (GDP) 2026. Retrieved November 30, 2021, from https://www.statista.com/statistics/268750/global-gross-domestic-product-gdp/
[7] Population by Country (2021) – Worldometer. (n.d.). Worldometer. Retrieved November 30, 2021, from https://www.worldometers.info/world-population/population-by-country/
[8] Kapitsa, Sergei P. (1996). “The phenomenological theory of world population growth.” Physics-Uspekhi. 39 (1): 57–71. Bibcode:1996PhyU…39…57K. doi:10.1070/pu1996v039n01abeh000127. Archived from the original on 11 May 2009. Retrieved 26 July 2013.
[9] Riley, J. C. (2005). Estimates of Regional and Global Life Expectancy, 1800–2001. Population and Development Review, 31(3), 537–543. https://doi.org/10.1111/j.1728-4457.2005.00083.x
[10] Roser, M. (2013, May 9). Future Population Growth. Our World in Data. Retrieved December 1, 2021, from https://ourworldindata.org/future-population-growth
[i] B. (n.d.). Human Population Growth | Boundless Biology. Lumen Learning. Retrieved December 16, 2021, from https://courses.lumenlearning.com/boundless-biology/chapter/human-population-growth/


