South Korea is a country in East Asia that shares the border with its rival, and nuclear power, North Korea. The total population of the country is 51.75 million people among which most people are based in Seoul and nearby areas. The country is a rapidly emerging one with high economic growth and a consistent rise in tourism as well. We can evaluate more about South Korea with the help of the following graphs.
Find Out More…
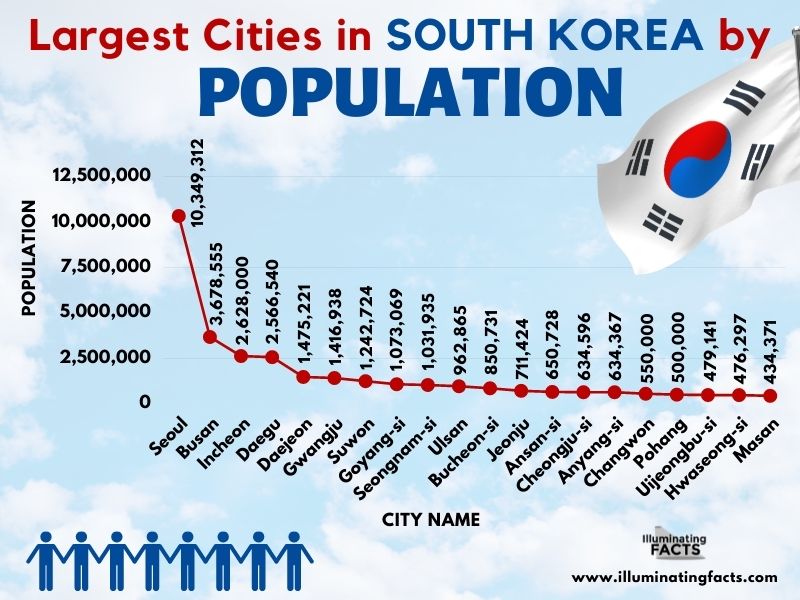
Largest Cities in South Korea by Population
South Korea’s population is diversely spread in multiple cities with most people residing in Seoul, the capital of the country. Seoul is home to 10.349 million people, the most for any city in South Korea. Busan comes 2nd with 3.67 million citizens living here while Incheon comes 3rd with 2.62 million people living here. Daegu also has close to 2.5 million citizens. Among the other largest cities in South Korea in terms of population are Daejeon, Gwangju, Suwon, Goyang-si, Seongnam-si, Ulsan, Bucheon-si, Jeonju, Ansan-si, Cheongju-si, Anyang-si, and Changwon. The graph shows the level of population in these cities.
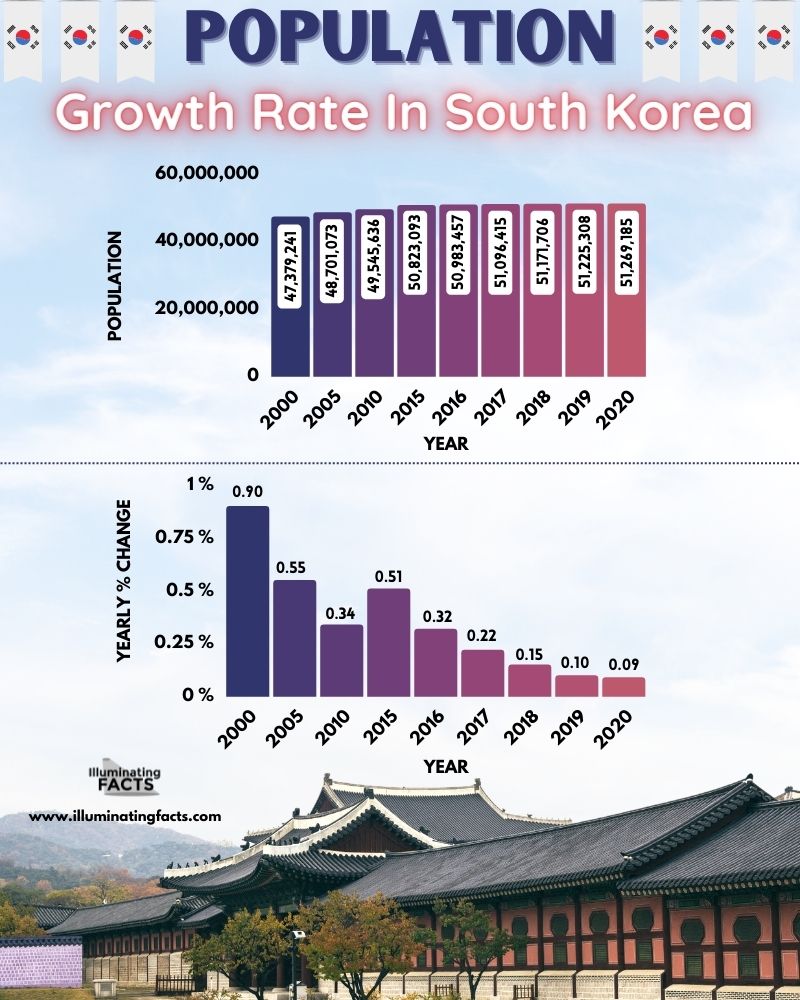
Population Growth Rate in South Korea
South Korea has experienced a gradual instead of rapid population growth. This is mainly because of the developmental programs as well as awareness of the population. In 2000, the total population of South Korea was 47.37 million which had a 5-year increase of around 0.7 to 1 million people. In 2005, the population rose to 48.7 million while in 2010, it rose to 49.54 million people. By 2015, South Korea was home to over 50.82 million citizens. Records from 2020 show that the population went up to 51.2 million people. This also implies the lowest population growth rate for the period.
The second graph highlights the overall population growth rate in terms of percentage for the same period. In 2000, the yearly percentage change was 0.9% which may seem low but was one of the highest ones at that time. By 2005, it dropped to 0.55% but was still considered high. In 2010, the yearly growth rate was 0.34%. There has been a constant drop in the population growth rate since 2015-onwards. As of 2020, the lowest population growth rate was seen which was 0.09%. This was a 10 times reduction compared with the yearly growth rate of 2000.
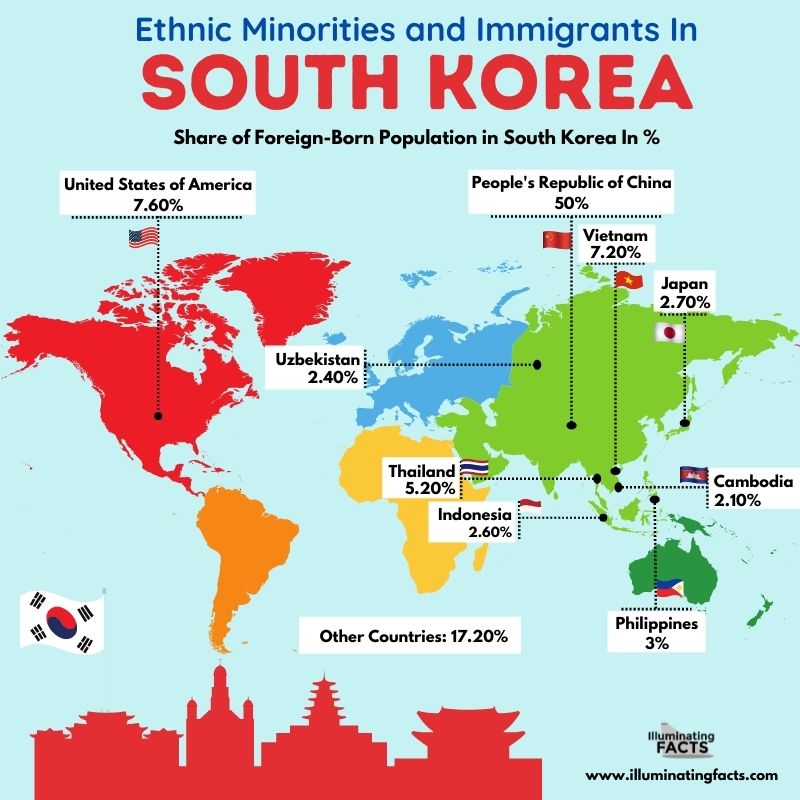
Ethnic Minorities and Immigrants in South Korea (Share of Foreign-Born in South Korea in %)
South Korea is a diverse nation and has been home to people from several countries. As a matter of fact, many nations have their ancestors belonging to South Korea. This is why it has a high share of foreign-born. 50% of foreign-born in South Korea belong to China. American citizens account for 7.6% of the share of foreign-born in South Korea while Vietnam has 7.2%. Thailand comes next which is 5.2% in terms of the share of foreign-born in South Korea. All remaining countries have either 3% or fewer share of foreign-born in South Korea, each.
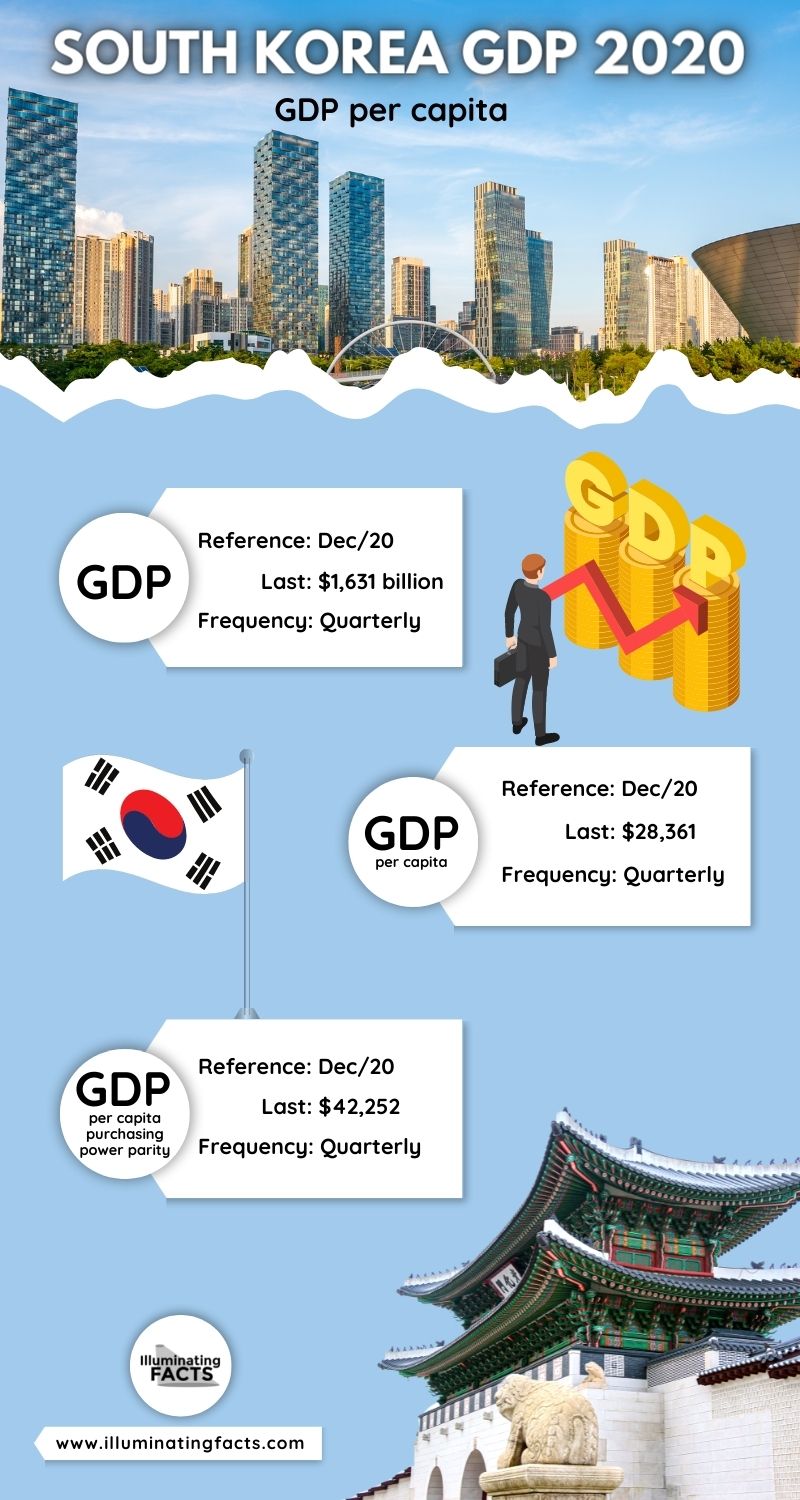
South Korea GDP Per Capita – 2020
South Korea is an economically stable and sound country. It ranks among the developing economies and has been rising in terms of income and economic figures over the past several years. This can be evaluated with the level of GDP of South Korea. As of 2020, the Quarterly GDP for South Korea was $1631 billion (December). For the same quarter, the GDP per capita of the country was $28,361. Lastly, GDP per capita in terms of purchasing power parity for the same period was $42,252. All these figures unanimously highlight the aspect that the country is on the right path to economic growth and stability.
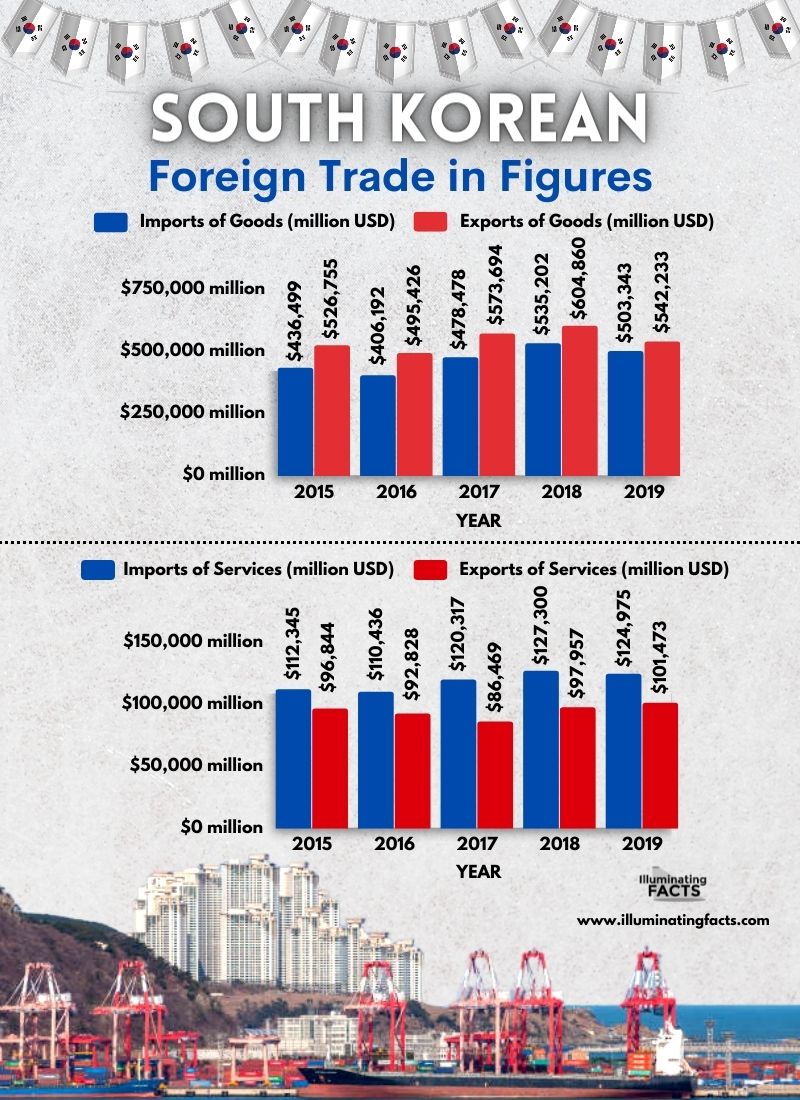
South Korean Foreign Trade in Figures
South Korea is a country that actively trades in both goods and services with other countries. As a result of this, it enjoys good trade relations with other countries and is a major trade partner in the global economy. As of 2015, South Korea imported goods worth $436,499 million while the exports for the same year amounted to $526,775 million. There has been a gradual growth in the coming years for both. In 2019, the imported goods amounted to $503,343 million while the exported goods amounted to $542,233 million. This shows that the country had an increase in trade.
In terms of services, South Korea is yet again an active economy. By 2015, the imported services amounted to $96,844 million while the exported services amounted to $112,345 million. In the coming years, with a consistent increase, the imported services amounted to $101,473 million in 2019 while the exported services were $124,975 million. This gives an idea that the country has been increasing its exports of goods and services to enjoy a positive balance in trade.
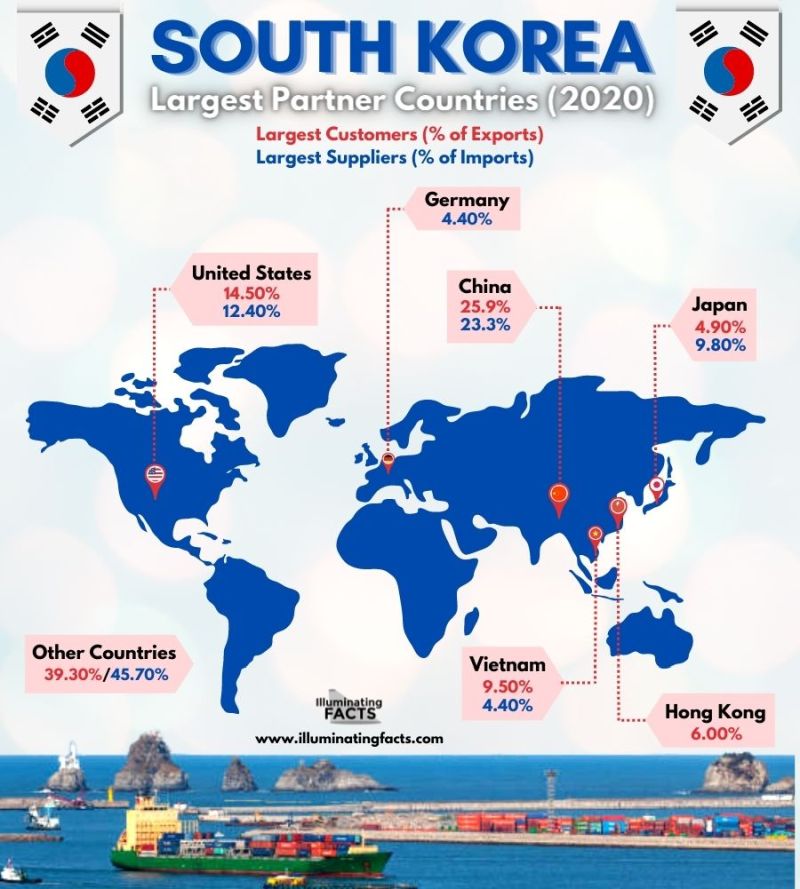
South Korea Largest Partner Countries (2020)
In terms of trade, South Korea has been emerging as it has been trading in terms of exports and imports with some of the largest and most well-developed economies in the world. China is the biggest trade partner of South Korea as it accounts for 25.9% of the exports and 25.3% of its imports of South Korea. The USA comes second which accounts for 14.5% of the exports for South Korea and 12.4% of the imports for South Korea. Germany is only an import partner accounting for 4.4% of the total imports of South Korea. Japan and Vietnam are two countries with major differences in import and export percentages averaging around 9.6% imports and 4.6% exports to South Korea.
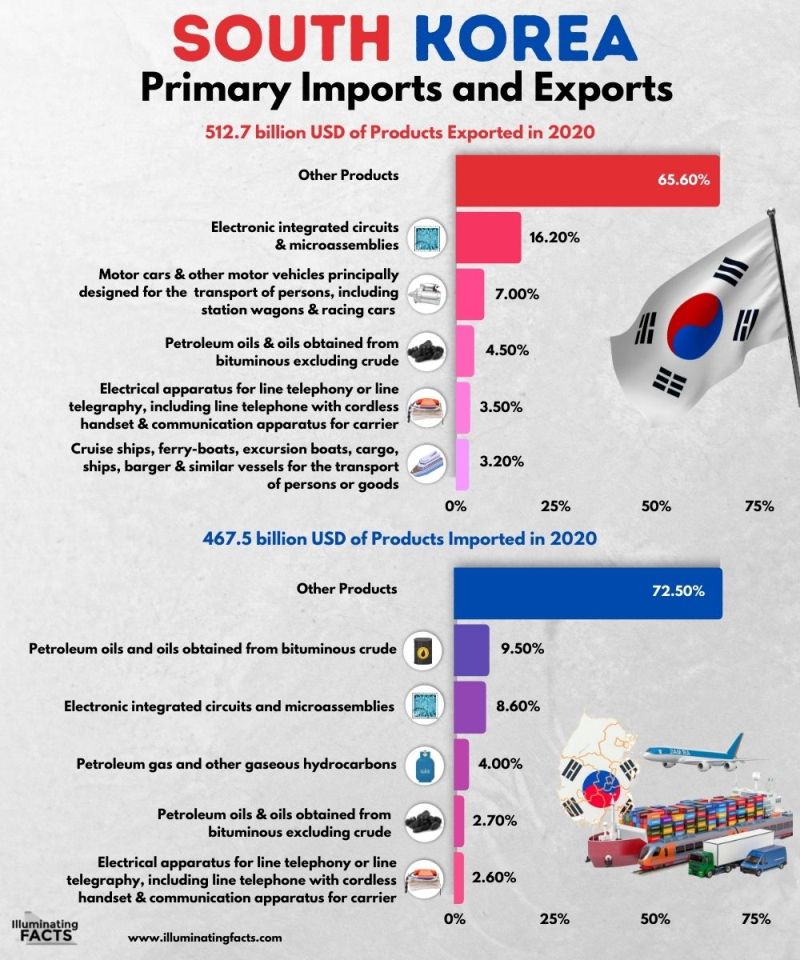
South Korea Primary Imports and Exports
The earlier graph showed the primary import suppliers and export customers of South Korea. The following graphs show the most important imports and exports of South Korea. In 2020, South Korea exported $512 billion of products including Electronic Integrated Circuits at the top with 16.2% of this massive amount. Cars, particularly race cars, wagon cars, and station wagons account for 7% of this total value of exports. Petrol is also a primary export of South Korea accounting for 4.5% of the total export value. Electrical Apparatus and Ship industry also benefit and make up 3.4% of the total export value, each. All other products account for 65.6% of the total export value.
Coming to the exports, it can be seen from the graph that the total value of imported goods was $467.5 billion. Petroleum oil and related products account for the most imports as they make up 16% of the total bill. Electronic circuits and small assemblies make up 8.6% of the total import bill of South Korea. Electrical apparatus makes up 2.6% of the total apparatus. All other products combined make up 72.5% of the total import bill which is a significant value.
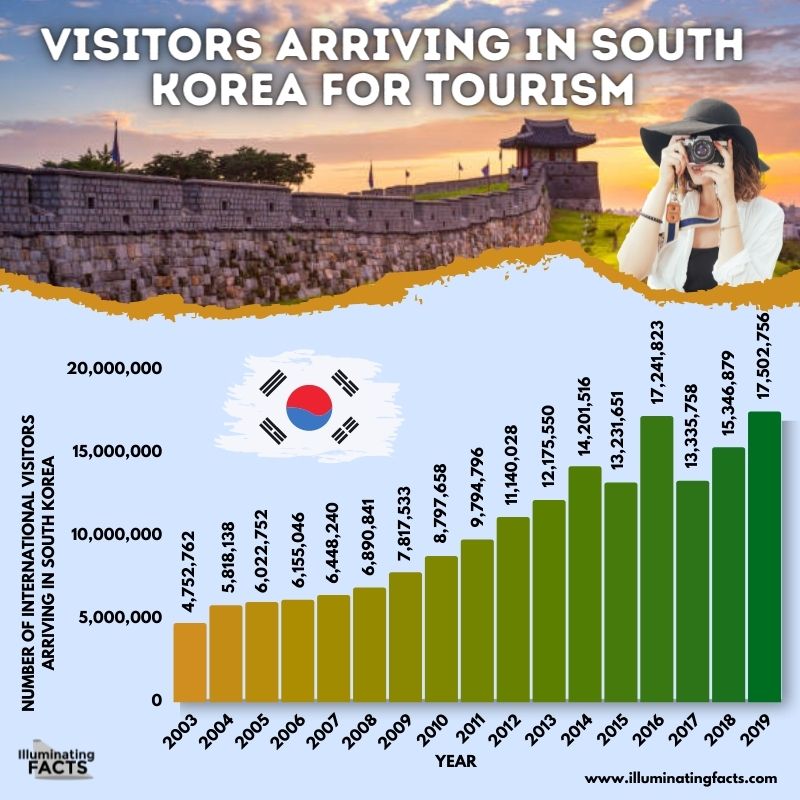
Visitors Arriving in South Korea for Tourism
Year by year, there has been a significant increase in tourism in South Korea. By 2003, there were 4.73 million people from all over the world visiting this small country. This helped in boosting up the economy’s GDP as well. In 2010, this amount had almost doubled as more than 8.7 million visitors arrived in South Korea for the purpose of tourism. By 2019, the number of visitors had again doubled and crossed 17.5 million visitors annually. The year-by-year major and positive changes highlight the fact that South Korea is becoming a popular tourist destination.
Top 12 Nationalities of International Visitors in South Korea (2019)
South Korea has become a major tourist destination. Tourists aren’t just coming from a particular country, rather people from numerous nationalities have been visiting South Korea. China accounts for the most visitors. In 2019 alone, more than 6 million Chinese people were visiting South Korea followed by Japan having over 3.2 million people visiting the country. The third country with the most visitors to South Korea in 2019 was Taiwan with over 1.2 million visitors. The USA came forth with a little over 1 million people. Other top nationalities that visited South Korea in 2019 include Hong Kong, Japan, Indonesia, Malaysia, Singapore, Russia, and the Philippines.
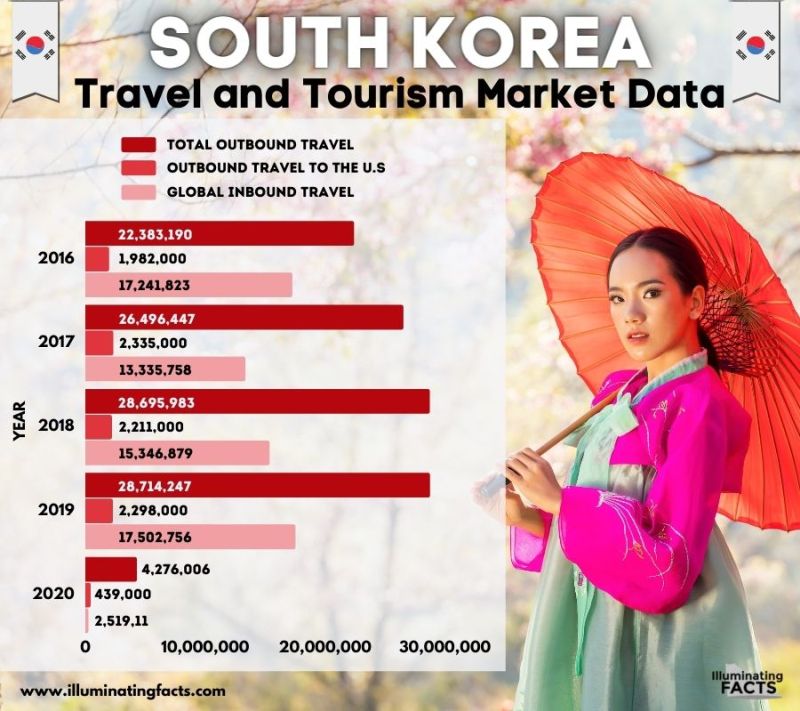
South Korea Travel and Tourism Market Data
The following graph shows travel and tourism market data which is based on three different factors. It shows total outbound travel, outbound travel to the US, and global inbound travel as well. In 2016, there were 22.3 million outbound travelers among which 1.98 million were for the US. In the same year, the global inbound travel was 17.2 million people. These figures peaked in 2019 when the total outbound travelers included 28.7 million people among which there were 2.29 million US travelers. 17.5 million people were inbound travelers. In 2020, this figure reduced to 4.27 million total outbound travelers with 0.4 million coming to the US and only 0.25 million coming to South Korea.


.jpg)
