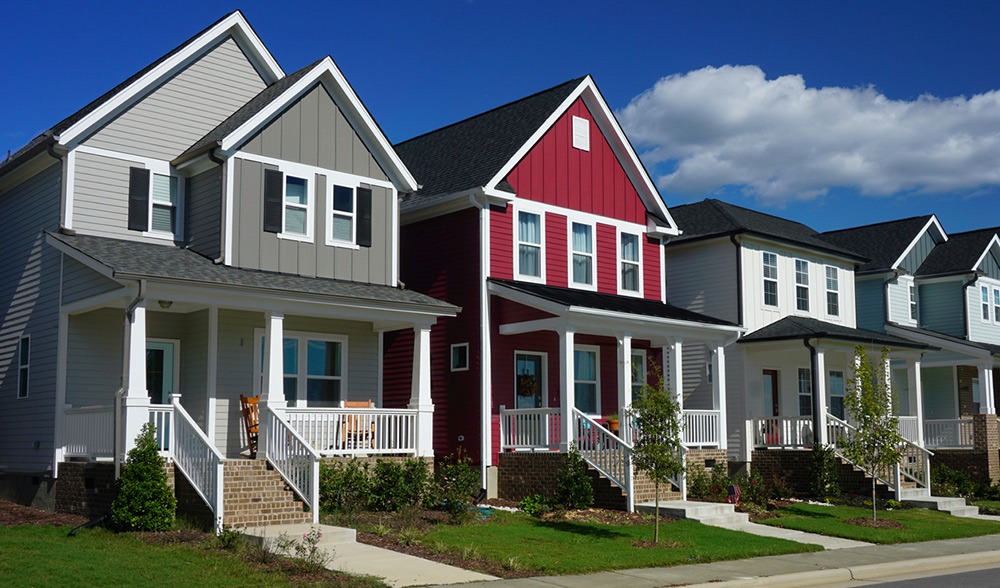
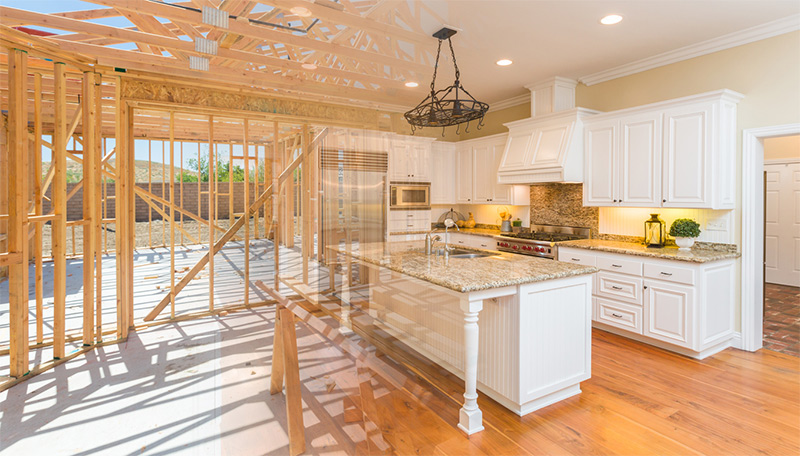
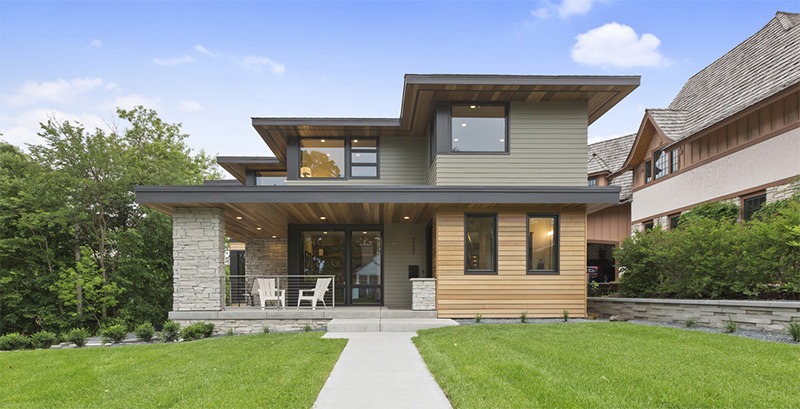
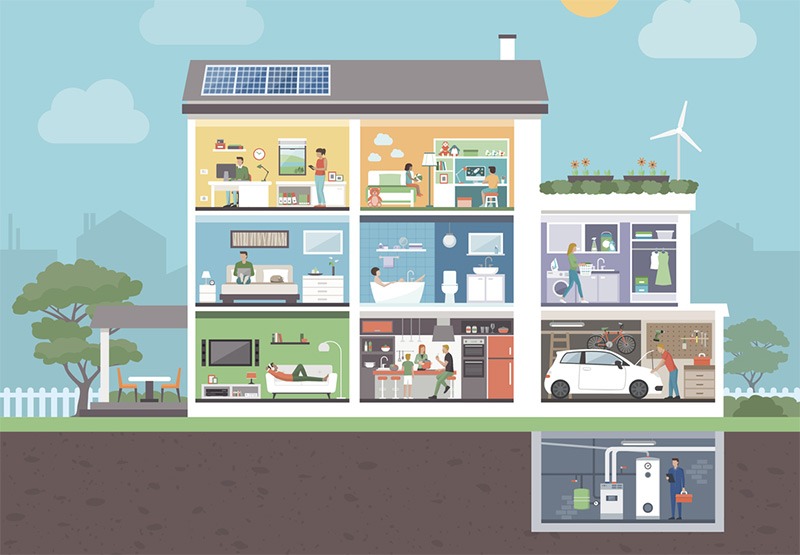
A house is a single-unit residential building that can be complex, from a wide range of rudimentary cabins to a complex structure of wood, concrete, masonry, and other materials. The house has air conditioning, ventilation, heating, electricity, plumbing systems, etc. A house with various roofing systems prevents rain from entering the living space. To secure the living space, a house contains doors and locks that protect the inhabitants from outside danger.
Most conventional modern houses contain one or more bedrooms, bathrooms, kitchen, living room, etc. A house can have a separate dining room, or the dining area integrated into another room. The American homes by the numbers mean the percentage of the US living in houses, apartments, flats, etc. Not all US citizens can afford to own a house, so they prefer renting a home. Hence, there are a lot of facts and figures regarding American homes by the numbers.
History
The English word house is derived from the Old English word hus, which means house, home, shelter, and dwelling. The earliest origin of the house and its interior is little known, but it dates back to the simplest forms of shelters. An exceptionally well-preserved house dates back to the fifth millennium BC. The contents from the date are still preserved and excavated, such as Tell Madhur in Iraq[1].
The first form of architecture is claimed in the theories of the Roman architect Vitruvius as a frame of wooden branches finished in a lump of clay. It is also known as a primitive hut. On the other hand, Philip Tabor states that the basis of the houses today comes from the contribution of the 17th-century Dutch houses[2].
When it comes to the idea of the house, Holland is the home. The idea’s crystallization dates back to the first three-quarters of the 17th century, when the Dutch Netherlands accumulated an unprecedented and paralleled capital accumulation. As a result, they emptied their pockets into the domestic space.
19th and 20th centuries
In the 19th and 20th centuries, in the American context, some professionals, such as doctors, typically operated from the living room or front room. They had a two-room office on their property, which was separated from their house. In the mid-20th century, the rise of high-tech equipment created a marked change that the contemporary physician usually worked in a hospital or an office[3].
The introduction of electronic systems and technology into homes has challenged the factor of privacy. Also, it is about the segregation of work from home. The advances in communication and surveillance technology have made it impossible to learn about private lives and personal habits. As a result, private life was becoming more public, and the desire for protective family life was increasing. It was all about separating professional life from private life[4].
Layout
Interior Space
Home architects design rooms to meet the ends of the people who will be living in the house. Feng shui is originally a Chinese method of moving based on the factors such as microclimates and rain[5]. It has recently broadened its scope to address interior space design, intending to promote harmonious effects on the people living inside the house.
Square footage
The square footage of a home in the United States indicates the living space while excluding the garage and other non-living spaces[6]. On the other hand, in Europe, the square meters are used for a house, indicating the area of the walls surrounding the house, including the non-living spaces and garage. Also, the number of floors or levels affects the square footage of a home.
In 2019, the median size of the single-family home built for sale in the United States was 2,531 square feet[7]. Since 1975, the size of American homes has nearly doubled. At that time, the average single-family home measured 1,660 square feet. The increasing square footage is illogical since the average family size has decreased over the same period.
Why Are American Homes Big?
Houses in the United States are among the largest houses in the world but just behind Australia. It is believed that there are several reasons for this, such as the concentration of wealth in the country. Also, the deeply rooted driving culture means that the cheapest land outside the city center is more accessible than within the city.
Where Are The Biggest Houses in the United States?
House size or square footage can vary from one state to another. The largest homes are located in the affluent urban areas and the South. McMansions or large homes are popular in Texas, with Houston leading the way in 2018[8].
Parts of Home
Many houses have several large rooms with various functions and several small rooms for other reasons. This can be a sleeping area, living/dining room with adequate services and facilities, and separate or combined sink and laundry areas. On the other hand, the larger properties have feature rooms such as spa rooms, indoor basketball courts, indoor pools, and other non-essential facilities.
Conventional modern homes contain at least one bedroom, bathroom, cooking area, or kitchen, and living room. Other parts of the home can be as follows:
Parts Of A House | ||
Alcove | Front room | Pantry |
Atrium | Garage | Parlor |
Attic | Hallway/Vestibule/Passage | Pew/Porch |
Basement/Cellar | Hearth | Rumpus room/Television room/Recreation Room |
Bathroom | Home-Office or Study Room | Shrines |
Bedroom | Kitchen | Stairwell |
Box-Room/Storage Room | Larder | Sunroom |
Conservatory | Laundry room | Swimming Pool |
Dining Room | Library | Window |
Family Room | Living Room | Workshop |
Fireplace | Loft | Foyer |
Nook | ||
American Housing Survey
Number Of Households In The U.S. (1960 – 2020)
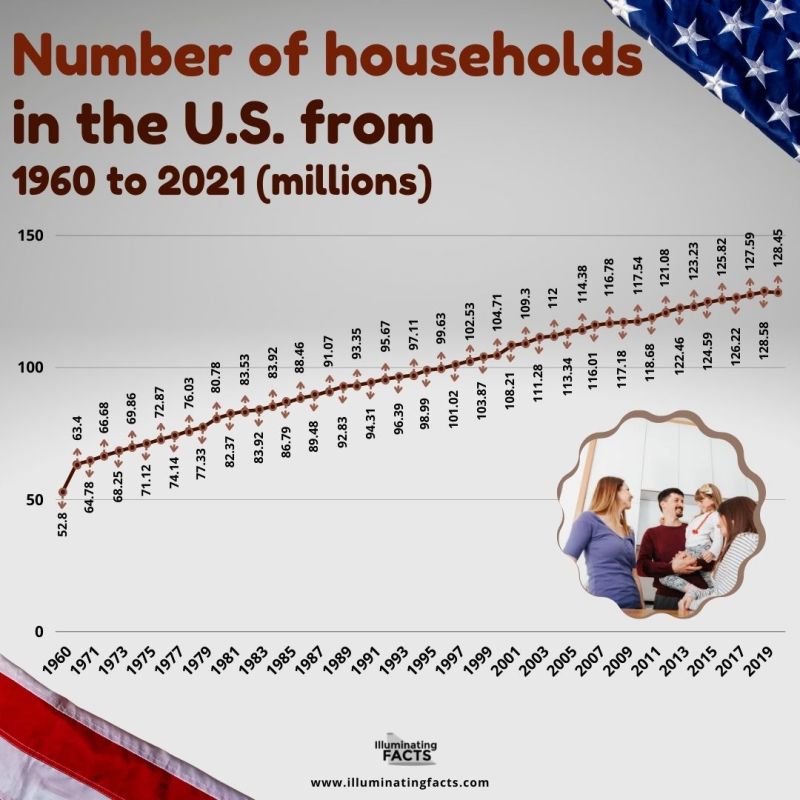
In 2020, there were 128.45 million households in the United States. Since 1960, there has been a significant change where there were only 52.8 million households in the United States.
What Counts As A Household?
According to the US Census Bureau, a household is considered to be the people living in a dwelling. This includes houses, apartments, or individual rooms and consists of related and unrelated people living together. For example, two roommates sharing a living space but unrelated would be considered households under the Census considerations.
Under Census considerations, it should be noticed that collective dwellings such as college dormitories are not counted as households.
Changes At Households
As the population of the United States has grown, the average household size in the United States has declined since 1960. In 1960, there was an average of 3.33 people per household, but in 2020 the number of people per household has decreased to 2.53. Also, two-person households make up the majority of US households.
Number of Households (million) (1960-2020)
Figure 2: Data by Statista[9]
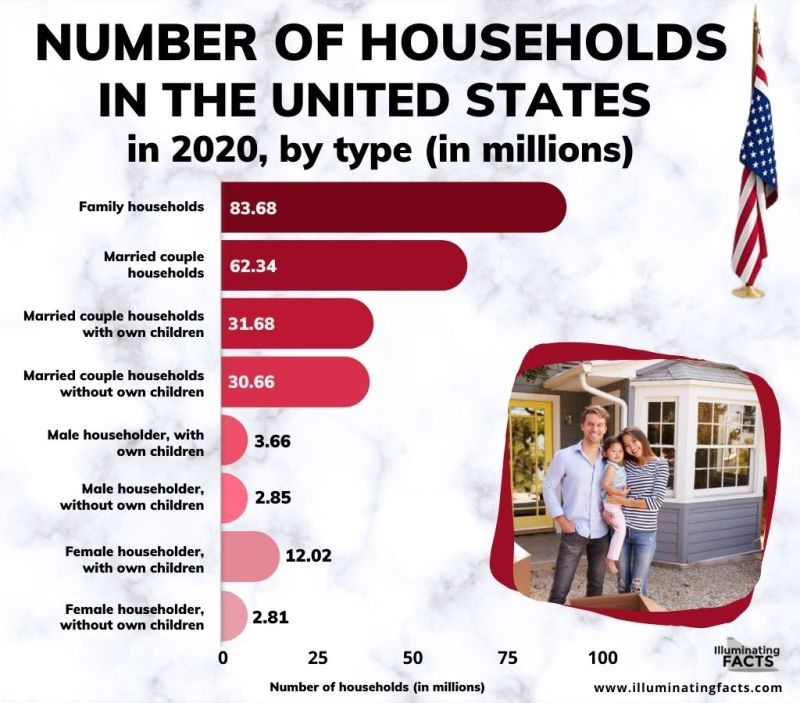
Number of Households in the U.S. By Type
As defined by the US Census Bureau, a household includes all people living in a house or occupying a housing unit. One person in each household is designated as the householder or head of the household. In most cases, this person can be one or two such as depending on the house owned, rented, or brought by the number of people.
A family consists of the head of the family and one or more other people living in the same household. Also, the relation of the people to the head of the family by birth, adoption, or marriage is considered while counting the households. A non-family household with unrelated persons such as unmarried partners or roommates consists of the head of the family.
Household type categorizes as follows:
- Family Households
- Married Couple Households
- Married Couple Households With Own Children
- Married Couple Households Without Own Children
- Male Householder With Own Children
- Male Householder Without Own Children
- Female Householder With Own Children
- Female Householder Without Own Children
Number of Households in Thousands by State
Figure 3: Data by Statista[10]
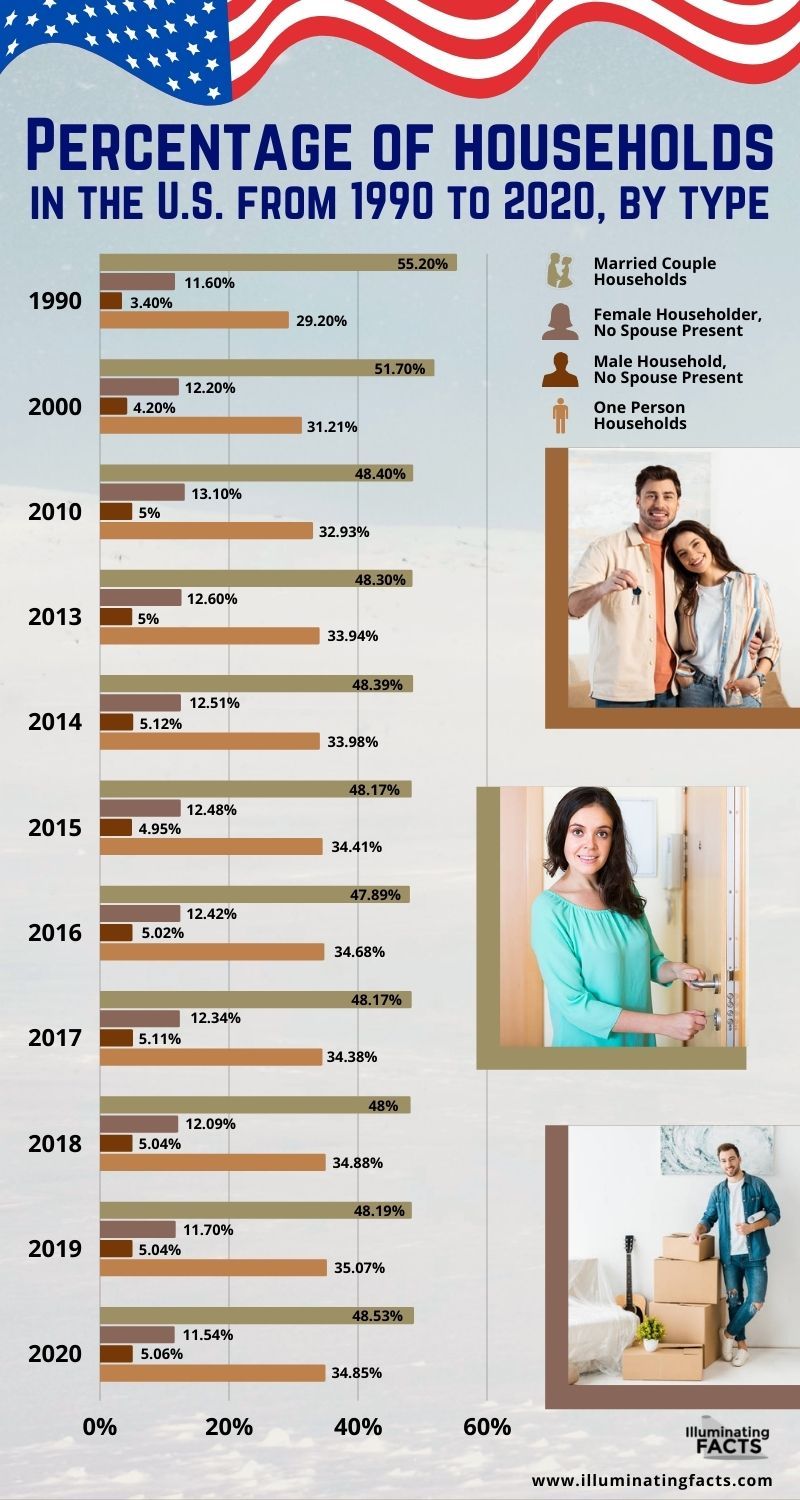
Percentage of Households in the U.S. From 1990 to 2020 by Type
This statistic shows the distribution of the households by type in the United States from 1990 to 2020. In 2020, there were about 34.85% of one-person households in the United States.
Percentage of Households in the U.S. (1990-2020)
Figure 4: Data by Statista[11]
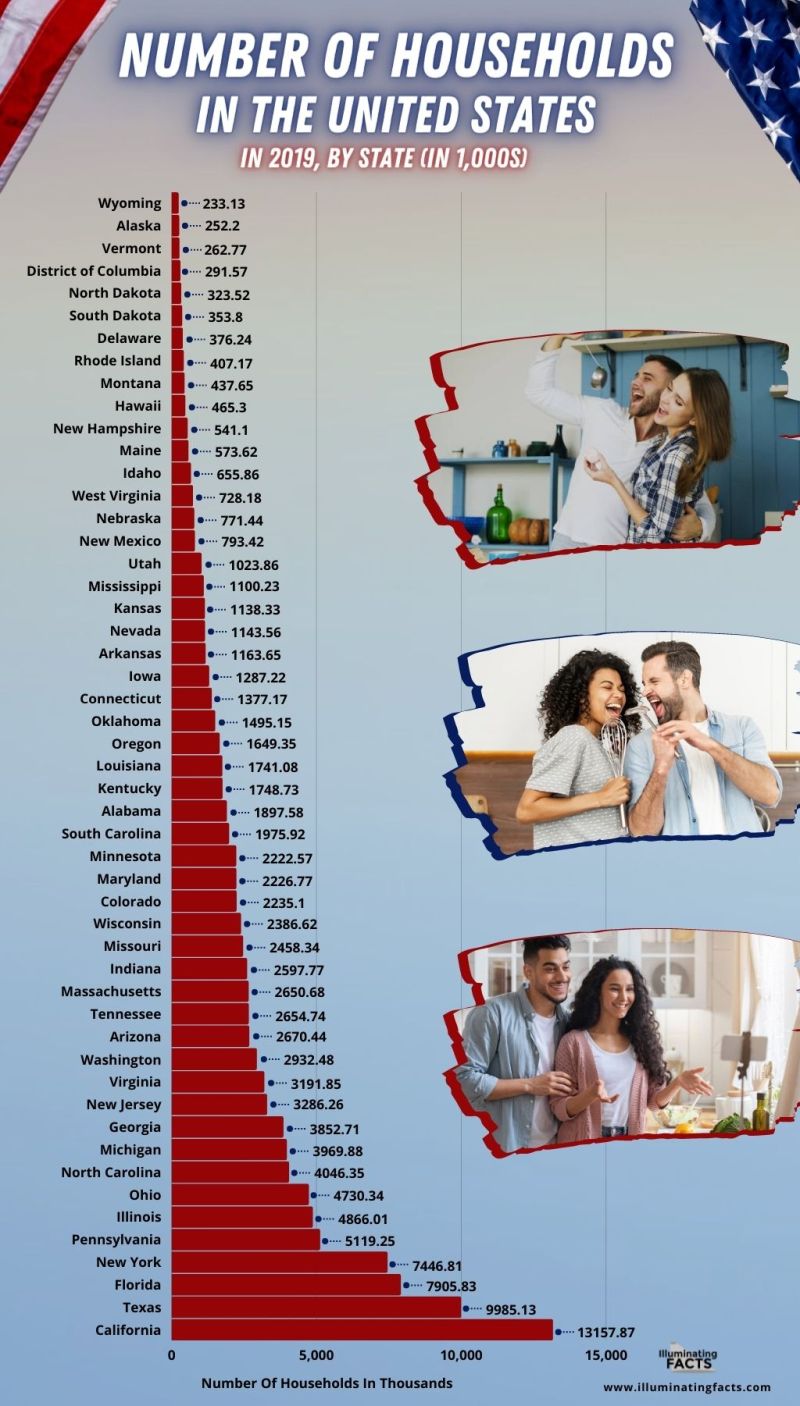
Number of Households in the United States in 2019, by State
This statistic shows the number of households by the state in the United States in 2019. In 2019, there were approximately 13.16 million homes in the federal state of California.
Number of Households In Thousands by State
Figure 5:Data by Statista[12]
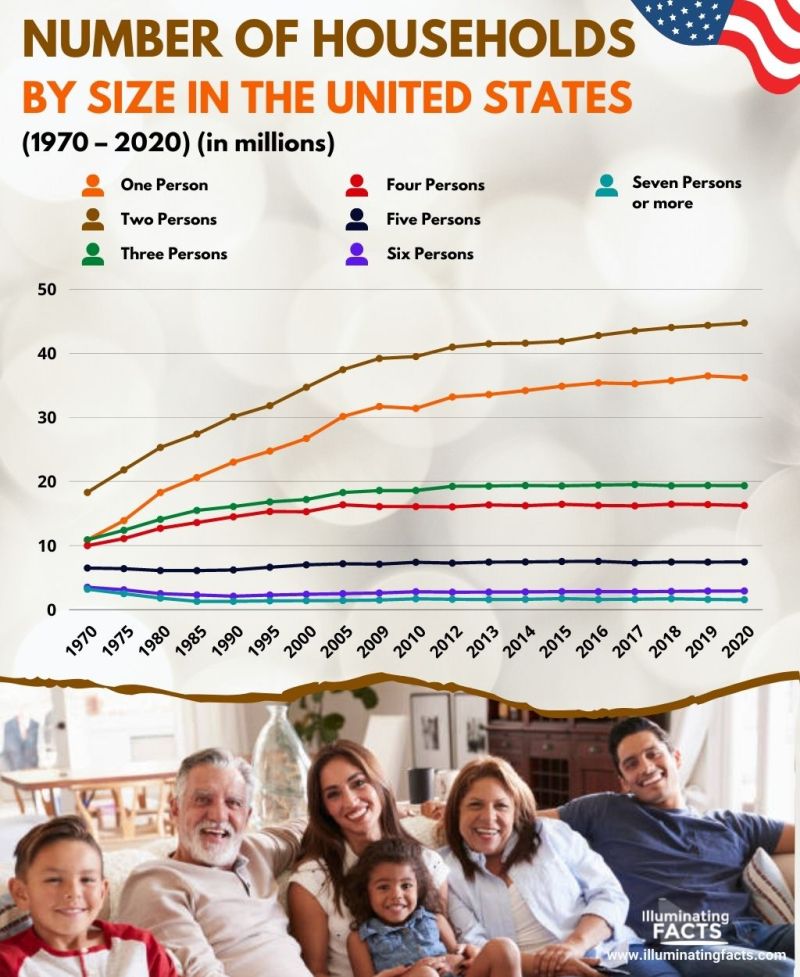
Number of Households by Size in the United States (1970 – 2020)
Figure 6: Data by Statista[13]
This graph shows the number of households in the United States by size from 1970 to 2020. In 2020, approximately 36.2 million people in the United States lived alone.
Home Ownership
The homeownership rate in the United States is the percentage of the dwellings owned by the occupants. In 2009, it remained similar to some of the post-industrial countries, with 67.4% of all occupied housing units. The homeownership rate can vary depending on the demographics such as household type, race, location, ethnicity, and type of establishment. In 2018, homeownership fell slower, such as 64.2%, compared to 1994[14].
Since 1960, the homeownership rate in the United States has been stable. It was the time when 65.2% of U.S. households owned their homes. Also, the homeowner’s equity has declined steadily since WWII, resulting in less than 50% of the home value on average.
Homeownership was more common in suburbs and rural areas. Almost three-quarters of suburban households owned their homes. Among the regions in the country, the Midwestern United States had the highest homeownership rate as compared to the Western United States.
Recent research has examined that there has been a decline in the homeownership rates among households headed by 25 to 44 years of age. Between 1980 and 2000, the homeownership rates have fallen dramatically while partially recovering during the US housing bubble of the early 2000s.
The result of this research indicates that there is a tendency to marry later and the family’s increased income after the 1980s. Hence, it mainly explains the decline in homeownership by young people[16].
Housing’s Contribution to GDP
The combined contribution of housing to GDP typically averages 15 to 18 percent and it occurs in two main ways:
Residential Investment
Residential investment averages around 3 to 5 percent of GDP. It includes the construction of the new single-family and multi-family structures, production of manufactured homes, residential renovations, and corridor fees.
Consumer Expenditure on Housing Services
Consumer expenditure on housing services averages around 12 to 13 percent of GDP on average. It includes utilities paid by the tenants and gross rents. Also, it includes utility payments and imputed rents by the owners.
Including owners’ imputed rents estimates the cost of renting owner-occupied housing units. In GDP, it has been a standard practice for a long time in national income accounting. If income imputed by the homeowners were not included, there would have been an increase in the homeownership rate that would lead to a decrease in GDP[16].
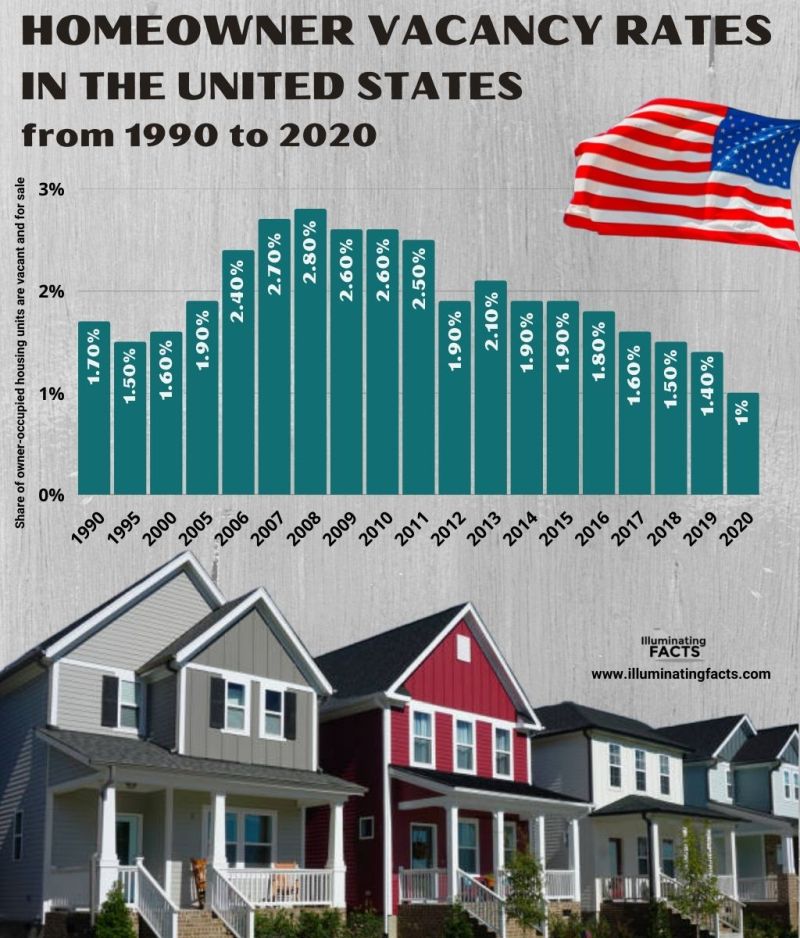
Homeowner Vacancy Rates (1990 – 2020)
The homeowner vacancy rate shows the percentage of owner-occupied homes that are vacant and for sale. The homeowner vacancy rate in the United States has gone from 2.8 percent in 2008 to 1 percent in 2020. Homeownership is a form of housing in which the owner of an inhabited property such as a house or apartment or any kind of real estate premises.
Homeowner Vacancy Rate (1990-2020)
Due to the high cost associated with owning a property, there are some perceived advantages and disadvantages for a long-term investment. As a result, there are different homeownership rates around the world. In Europe, Romania has the highest homeownership rate of 96 percent in 2019, and the lowest homeownership rate is in Switzerland with 41.6 percent.
People may have different opportunities or desires to own a home depending on their age, nationality, social status, economic status, profession, education, marital status, ethnic origin, birthplace, etc. The homeownership rate of married couples is higher than that of single men or women. However, most millennials in the United States eventually plan to own a home.
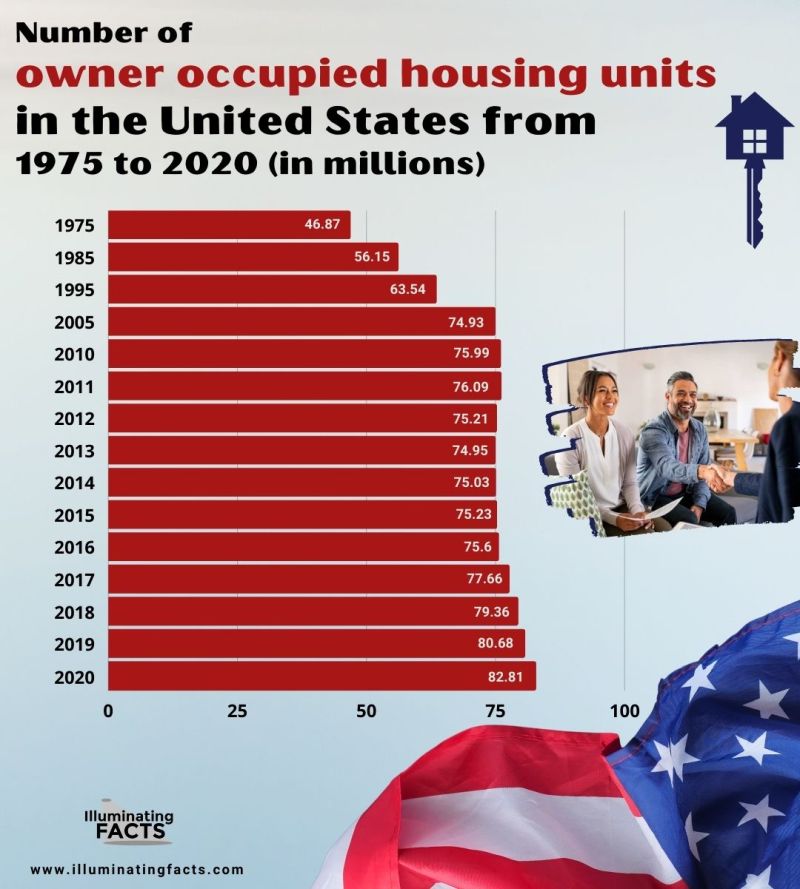
In the United States, homeownership is a good investment with the security of no risk of foreclosure and financial terms such as owning valuable real estate. In 2020, there were 82.51 million owner-occupied dwellings in the United States with a marked increase as compared to the previous four decades.
Number of Housing Units (millions) (1975-2021)
Figure 10: Data by Statista[20]
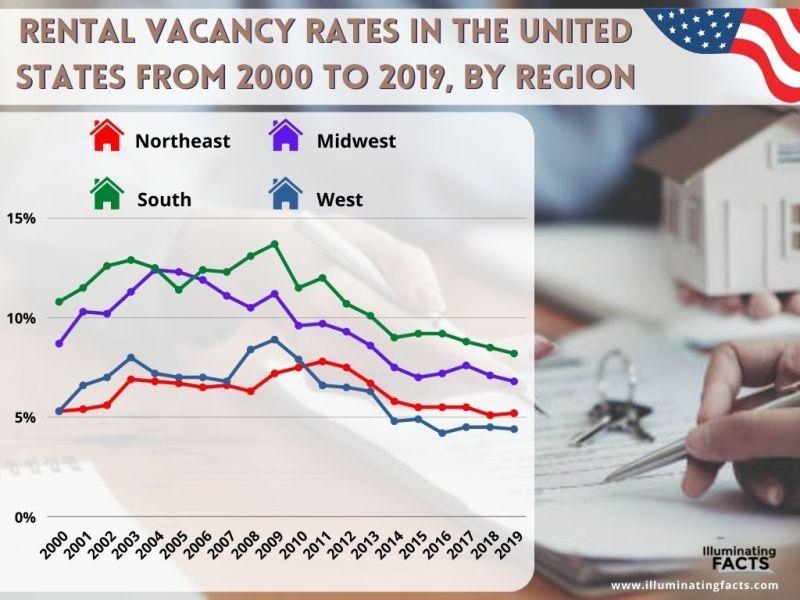
Rental Vacancy By Region (2000 – 2020)
In 2020, the rental vacancy rate in the United States Southern region was 8.2 percent. This means that 8.2 percent of the available rental units were vacant during those years. The Midwest had the second-highest vacancy rate, and the Northwest and West. Since 2014, the vacancy rate has declined across all the regions, but the regional differences remain clear.
Why Is There This Division?
The proportion of the US population living in the South and Midwest has declined in recent decades. On the other hand, the West and Northeast are facing higher population growth[21]. The demographic changes have led to a decrease in demand for housing among the former and an increase among the latter.
The West and Northeast have larger urban areas attracting more residents than the rural areas. It is because of the greater employment opportunities. Median home selling prices are higher in the West and Northeast than in the other two divisions or regions. Also, most of the price growth in the regions with higher prices is growing faster.
Figure 11: Data by Statista[22]
Homeownership by Race
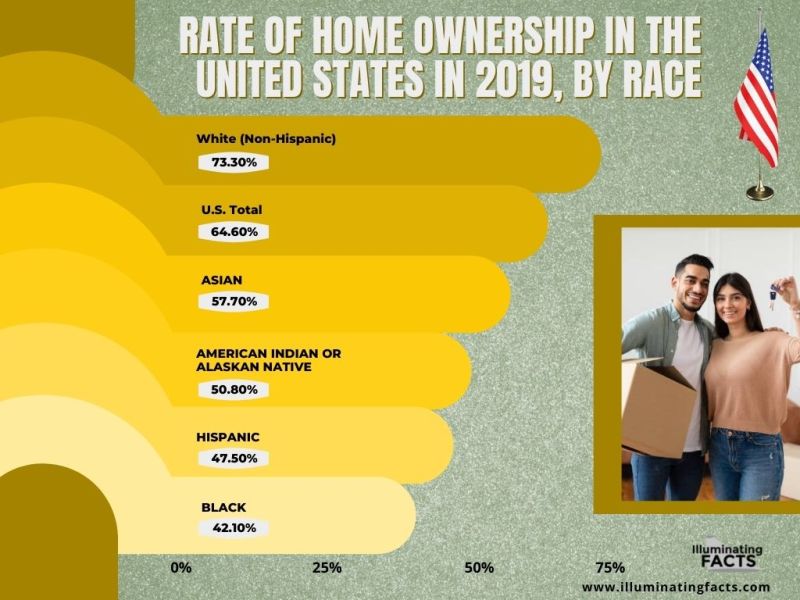
The rate of homeownership, as well as its evolution over time, has varied considerably by race. Most homeowners in the United States are White, Native American, and Asian households. The homeownership rates for Latinos and African Americans hardly reach the 50 percent threshold. As a result, whites have the highest homeownership rates, followed by Asians and Native Americans.
Hispanics have the lowest homeownership rate in the United States except from 2002 to 2005. During the second half of the 2000s, the homeownership of Hispanics increased more than Afro-Americans. The temporal fluctuations were slight for all the races.
The largest increase in the percentage of homeowners in the first half of the 2000s was among the non-white minorities. In 2006, the minority homeownership rating reached 60 percent, a significant change as less than half of all minority households owned a home in 1994.
The minority homeownership rate has increased by 25.6 percent, from 47.7 percent in 1993 to 59.9 percent in 2006. On the other hand, the rate fell after a peak in 2006 with overall homeownership rates.
Race | |||||
Years | White (Non-Hispanic) | Asian American | Native American | African American | Hispanic or Latino |
1994 | 70 | 51.3 | 51.7 | 42.3 | 41.2 |
1995 | 70.9 | 50.8 | 55.8 | 42.7 | 42.1 |
1996 | 71.7 | 50.8 | 51.6 | 44.1 | 42.8 |
1997 | 72 | 52.8 | 51.7 | 44.8 | 43.3 |
1998 | 72.6 | 52.6 | 54.3 | 45.6 | 44.7 |
1999 | 73.2 | 53.1 | 56.1 | 46.3 | 45.5 |
2000 | 73.8 | 52.8 | 56.2 | 47.2 | 46.3 |
2001 | 74.3 | 53.9 | 55.4 | 47.7 | 47.3 |
2002 | 74.5 | 54.7 | 54.6 | 47.3 | 48.2 |
2003 | 75.4 | 56.3 | 54.3 | 48.1 | 46.7 |
2004 | 76 | 59.8 | 55.6 | 49.1 | 48.1 |
2005 | 75.8 | 60.1 | 58.2 | 48.2 | 49.5 |
2006 | 75.8 | 60.8 | 58.2 | 47.9 | 49.7 |
2007 | 75.2 | 60 | 56.9 | 47.2 | 49.7 |
2008 | 75 | 59.5 | 56.5 | 47.4 | 49.1 |
2009 | 74.8 | 59.3 | 56.2 | 46.2 | 48.4 |
2010 | 74.4 | 58.9 | 52.3 | 45.4 | 47.5 |
2011 | 73.8 | 58 | 53.5 | 44.9 | 46.9 |
2012 | 73.5 | 56.6 | 51.1 | 43.9 | 46.1 |
2013 | 73.3 | 57.4 | 51 | 43.1 | 46.1 |
2014 | 72.6 | 57.3 | 52.2 | 43 | 45.4 |
2015 | 71.9 | 56.1 | 50.3 | 42.3 | 45.6 |
Figure 12: Data by US Census Bureau, 2016[23]
Figure 13: Data by Statista[24]
The above graph shows the homeownership rate in the United States in 2019 by race. In 2019, the highest homeownership rate was 73.3 percent. These housing units were owned by whites, followed by other races.
Housing Units For Sale
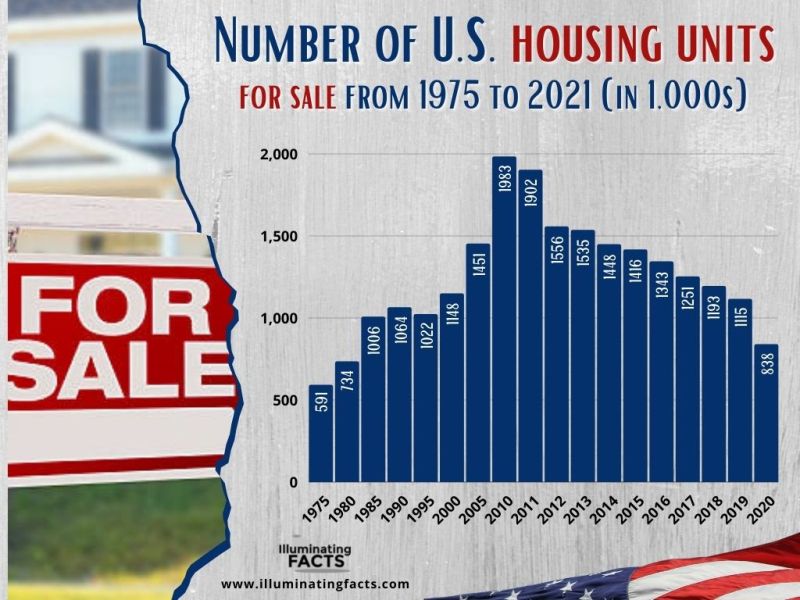
The United States real estate market was both a trigger and major shock during the recession from 2007 to 2009. Attractive home prices, low standards for home loans, and low mortgage interest rates led to the growth of subprime debt. It means that the homeowners struggled to pay off their mortgages during the recessions. Since then, the real estate market has recovered[25].
Figure 14: Data by Statista[26]
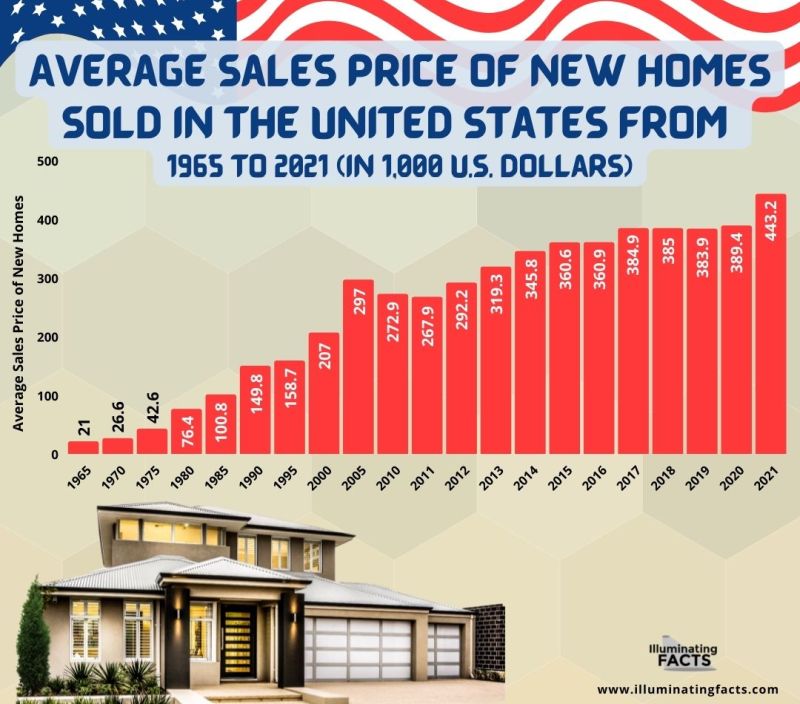
Average Sales Price of New Home For Sale (1965 – 2021)
After stabilizing between 2017 and 2019, U.S. house prices increased in 2020 and 2021. The median selling price of a new home in 2020 was $389,400, but in 2021 it was $408,800. From 2019 to 2020, the number of mortgage-financed homes was $470,000 to $561,000, which is more than in 2007. The interest rates at lower levels than the previous years have aspired the homeowners to move on and enter the market in 2020[27].
Figure 16: Data by Statista[30]
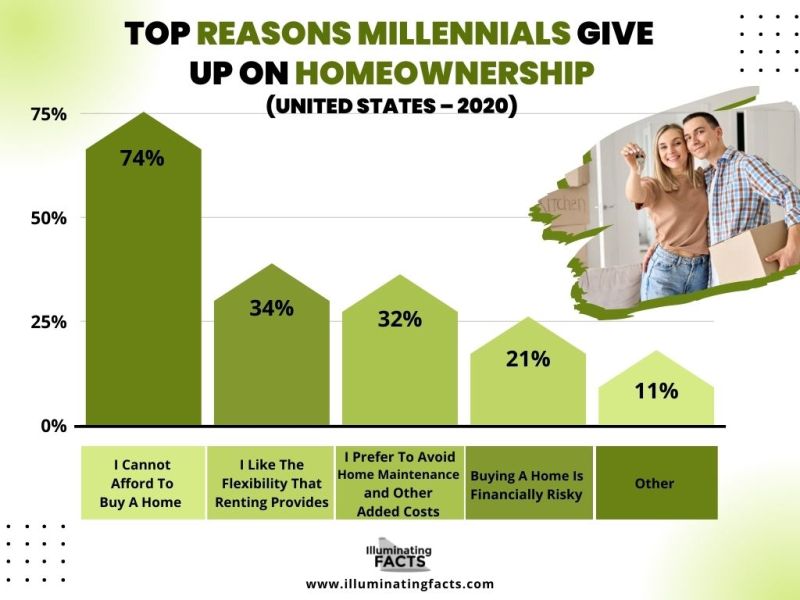
Millennials Expect to Always Rent Than Homeownership
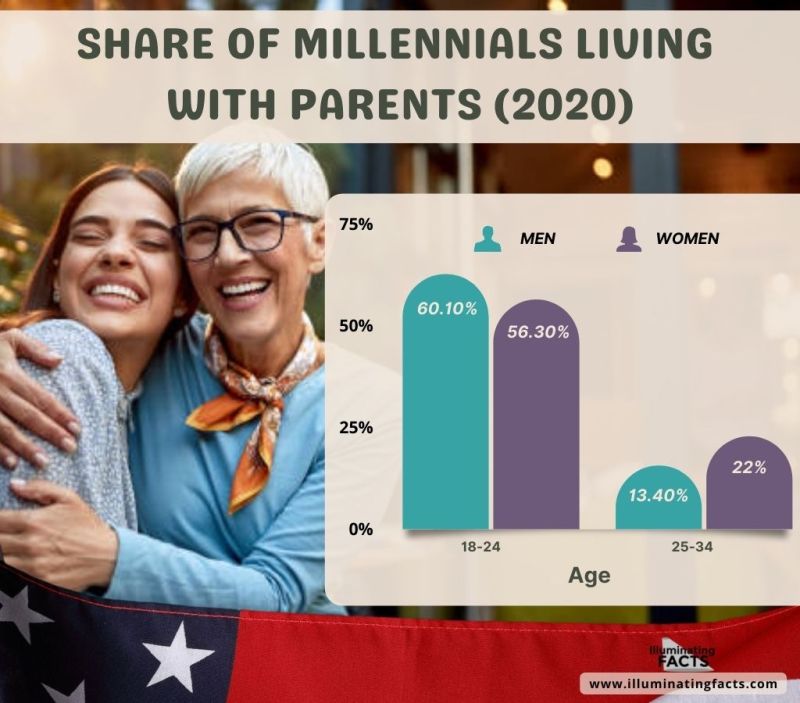
In 2020, three in four Millennials who had given up on homeownership said they most likely still rented because they felt they couldn’t own a home. About a third of Millennials had no plans to own a home because of the flexibility associated with renting. In recent years, the proportion of the Millennials who expect to rent has consistently been rising.
Figure 17: Data by Statista[31]
Figure 18: Data by Statista[32]
Interesting Facts About American Homes By Numbers
- The word House comes from the Old English word Hus which means home, house, shelter, and dwelling.
- The houses we see today are based on the contribution of the 17th-century Dutch houses.
- In the 19th and 20th centuries, people had two-room offices on their property, which was separated from their house.
- A household is a social unit living in a house, such as family, social group, roommates, unrelated people, etc.
- In the United States, the square footage of a home is the living space while excluding the non-living space and garage.
- In 2019, the median size of the single-family home built for sale in the United States was 2,531 square feet.
- In the United States, the houses are among the largest houses in the world but just behind Australia.
- McMansions or large homes are popular in Texas, with Houston leading the way in 2018.
- In 2020, there were 128.45 million households in the United States.
- According to the US Census Bureau, a household is considered to be the set of people living in a dwelling. For example, two roommates sharing a living space but unrelated would be considered households under the Census considerations.
- In 2020, there were about 34.85% of one-person households in the United States.
- In 2019, there were approximately 13.16 million homes in the federal state of California.
- In 2020, approximately 36.2 million people in the United States lived alone.
- The homeownership rate can vary depending on the demographics such as household type, race, location, ethnicity, and type of establishment.
- The combined contribution of housing to GDP typically averages 15 to 18 percent, and it occurs in two main ways: Residential Investment and Consumer Expenditure on Housing Services.
- From 2008 to 2020, the homeowner vacancy rate in the United States has decreased from 2.8 percent to 1 percent.
- The population living in the Midwest and the southern United States has declined over the years. On the other hand, the population is growing rapidly in the Northeast and West United States.
- In 2019, the highest homeownership by whites was 73.3 percent. The remaining housing units were owned by other races such as Native Americans, Asians, Latinos, African Americans, and Hispanics.
- In 2020, the selling price of a median new home was $389,400, but in 2021 it rose to $408,800.
- From 2019 to 2020, the number of mortgage-financed homes was sold for $470,000 to $561,000 more than in 2007.
- In 2020, three in four Millennials had given up on homeownership because they are more likely to have a place to rent than to own a house.
- Smart home devices such as air conditioning control, digital locks, etc., are preferred by 37 percent of the surveyed respondents.
References
[1] Lloyd, S., & Curtis, J. (1982). Fifty years of Mesopotamian discovery. London: British school of archaeology in Iraq.
[2] Hill, J. (1999). Occupying architecture. London: Routledge.
[3] Doctor’s and Dentist’s Offices. (2021). [Blog]. Retrieved from https://melnickmedicalmuseum.com/exhibits/doctors-and-dentists-offices/
[4] Hill, J. (2006). Immaterial architecture. London: Routledge.
[5] Feng Shui course gains popularity. (2009). Retrieved 9 November 2021, from https://www.asiaone.com/News/Education/Story/A1Story20090206-119946.html
[6] Iyyer, C. (2009). Land management. New Delhi: Global India Publications.
[7] Size of new single-family homes in the U.S. | Statista. (2020). Retrieved 9 November 2021, from https://www.statista.com/statistics/529371/floor-area-size-new-single-family-homes-usa/
[8] U.S. cities with largest homes 2018 | Statista. (2018). Retrieved 9 November 2021, from https://www.statista.com/statistics/1053220/largest-homes-cities-usa/
[9] U.S.: Number of households 1960-2020 | Statista. (2020). Retrieved 9 November 2021, from https://www.statista.com/statistics/183635/number-of-households-in-the-us/
[10] Number of U.S. households, by type 2020 | Statista. (2020). Retrieved 9 November 2021, from https://www.statista.com/statistics/242254/number-of-us-households-by-type/
[11] Percentage of U.S. households, by type 2020 | Statista. (2020). Retrieved 9 November 2021, from https://www.statista.com/statistics/242244/percentage-of-us-households-by-type/
[12] Number of U.S. households, by state 2019 | Statista. (2020). Retrieved 9 November 2021, from https://www.statista.com/statistics/242258/number-of-us-households-by-state/
[13] Number of U.S. households by size 1970-2020 | Statista. (2020). Retrieved 9 November 2021, from https://www.statista.com/statistics/183779/number-of-households-in-the-us-by-size-of-household/
[14] The U.S. Census Bureau. (2021). QUARTERLY RESIDENTIAL VACANCIES AND HOMEOWNERSHIP, THIRD QUARTER 2021 [Ebook] (p. 6). Retrieved from https://www.census.gov/housing/hvs/files/currenthvspress.pdf
[15] GURRENTZ, B. (2018). For Young Adults, Economic Security Matters for Marriage. Retrieved 9 November 2021, from https://www.census.gov/library/stories/2018/06/millennial-marriages.html
[16] Homeownership Rate in the United States. (2021). Retrieved 9 November 2021, from https://fred.stlouisfed.org/series/RHORUSQ156N#0
[17] Housing’s Contribution to Gross Domestic Product – NAHB. Retrieved 9 November 2021, from https://www.nahb.org/news-and-economics/housing-economics/housings-economic-impact/housings-contribution-to-gross-domestic-product#:~:text=Housing’s%20combined%20contribution%20to%20GDP,homes%2C%20and%20brokers’%20fees.
[18] National Association of Home Builders. (2020). Retrieved 9 November 2021, from https://www.nahb.org/-/media/NAHB/news-and-economics/docs/housing-economics/economic-impact/housing-contribution-to-gdp.xls
[19] Homeowner vacancy rates in the U.S. 2020 | Statista. (2021). Retrieved 9 November 2021, from https://www.statista.com/statistics/184904/vacancy-rates-for-us-homeowner-units-since-2005/
[20] Number of owner occupied homes in the U.S. 2021 | Statista. (2021). Retrieved 9 November 2021, from https://www.statista.com/statistics/187576/housing-units-occupied-by-owner-in-the-us-since-1975/
[21] Regional distribution of the U.S. population from 1790-2019 | Statista. (2020). Retrieved 9 November 2021, from https://www.statista.com/statistics/240766/regional-distribution-of-the-us-population/
[22] U.S. rental vacancy rates by region 2020 | Statista. (2021). Retrieved 9 November 2021, from https://www.statista.com/statistics/186392/vacancy-rates-for-rental-units-by-us-region-since-2000/
[23] Homeownership Rates by Race and Ethnicity of Householder: 1994 to 2016. Retrieved 9 November 2021, from https://www.census.gov/housing/hvs/files/annual16/ann16t_22.xlsx
[24] U.S. home ownership rate, by race 2019 | Statista. (2020). Retrieved 9 November 2021, from https://www.statista.com/statistics/639685/us-home-ownership-rate-by-race/
[25] Topic: U.S. Housing Market. (2021). Retrieved 9 November 2021, from https://www.statista.com/topics/1618/residential-housing-in-the-us/
[26] U.S. housing stock: units for sale 2020 | Statista. (2021). Retrieved 9 November 2021, from https://www.statista.com/statistics/187572/housing-units-for-sale-in-the-us-since-1975/
[27] House price to income ratio in the U.S. 2021 | Statista. (2021). Retrieved 9 November 2021, from https://www.statista.com/statistics/591435/house-price-to-income-ratio-usa/
[28] Number of new U.S. home sales by financing type 2020 | Statista. (2021). Retrieved 9 November 2021, from https://www.statista.com/statistics/185206/us-house-sales-with-fha-and-va-insured-mortgages-from-2002/
[29] COVID-19 effect on U.S. homeownership plans 2020 | Statista. (2020). Retrieved 9 November 2021, from https://www.statista.com/statistics/1220507/covid-homeownership-plans-genz-millennials-gen-x-baby-boomers-usa/
[30] Average new home sales price in the U.S. 2021 | Statista. (2021). Retrieved 9 November 2021, from https://www.statista.com/statistics/240991/average-sales-prices-of-new-homes-sold-in-the-us/
[31] Millennials’ homeownership obstacles U.S. 2020 | Statista. (2021). Retrieved 9 November 2021, from https://www.statista.com/statistics/784988/homeownership-obstacles-of-millennials-usa/
[32] U.S. Millennials living with parents by gender 2020 | Statista. (2020). Retrieved 9 November 2021, from https://www.statista.com/statistics/595249/millennials-live-in-their-parents-home-gender/
[33] Most important apartment amenities U.S. 2020 | Statista. (2021). Retrieved 9 November 2021, from https://www.statista.com/statistics/875040/most-important-apartment-features-for-renters-usa/

