America has a population of 329.5 million as of 2020. However, this figure has constantly grown and evolved in the past 20 years. Multiple cultures, ethnicities, and immigrants from the different types of American households. For this reason, we can see that there is a changing size of American households over the past few years. With the help of the following graphs, the constant change in American households can be evaluated.
Find Out More…
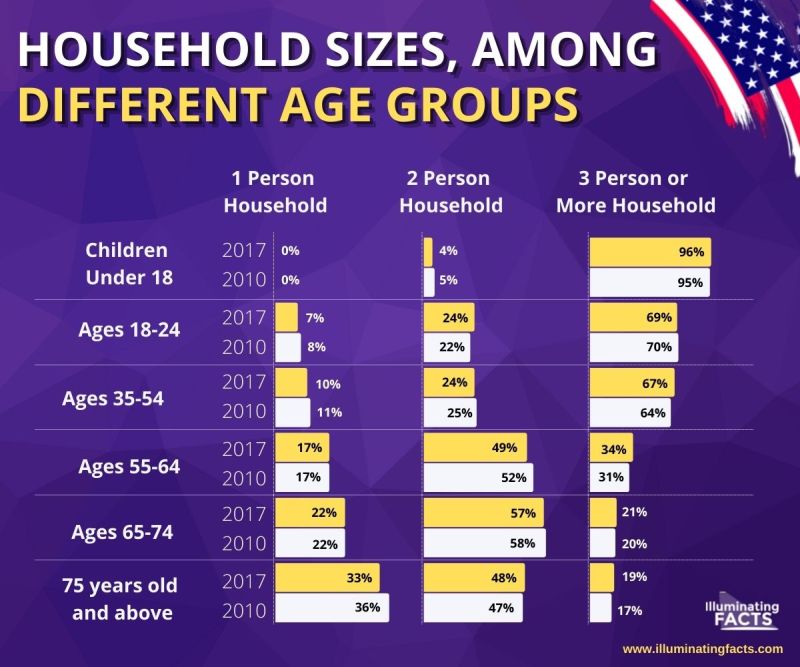
Household Sizes Among Different Age Groups
The following graph shows the household sizes among different age groups in the US. 4% of children under 18 lived in a 2-person household setup in 2010 and got to 5% by 2017. This means that they lived with a single parent. For a 3-person household setup, 96% of children lived in 2010 while 95% in 2017. Between 2010 to 2017, about 7% to 8% of people lived in a 1-person setup aging 18 to 24. About 23% of people lived in a 2-person household setup while those with a 3-person household setup accounted for almost 70%. The graph summarizes that the younger age groups were living in a 3-person household setup more while elders were living in a 1-person household setup.
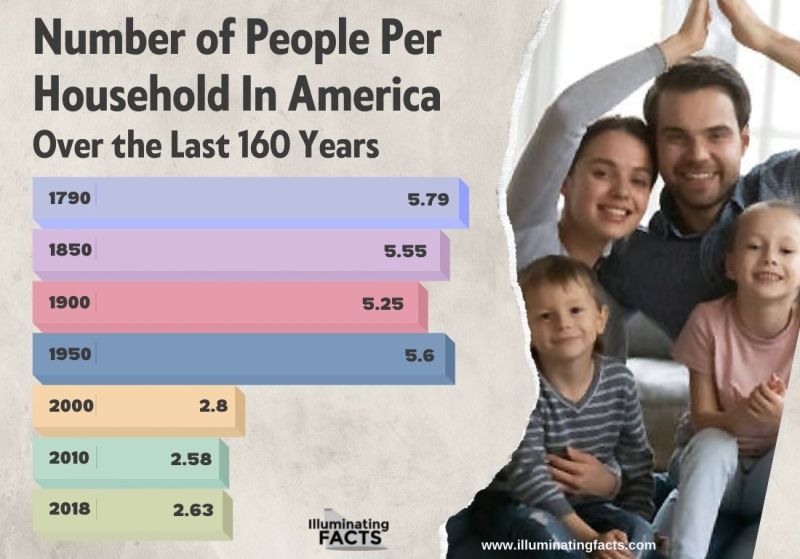
Number of People per Household in America Over the Last 160 Years
In America, there was once a trend of having many children and huge families. For this reason, the number of people per household was quite a lot at one time. However, post-2000s, we can see that this trend has reduced and so has the number of people per household. In 1790, there were about 5.79 people per household in America which reduced to 5.55 in 1850 and then to 5.25 by 1900. A slight increase was noticed in 1900 when the number reached 5.6. However, from the year 2000, this number reduced to 2.8 people per household. By 2018, this number fell to 2.63 people per household.
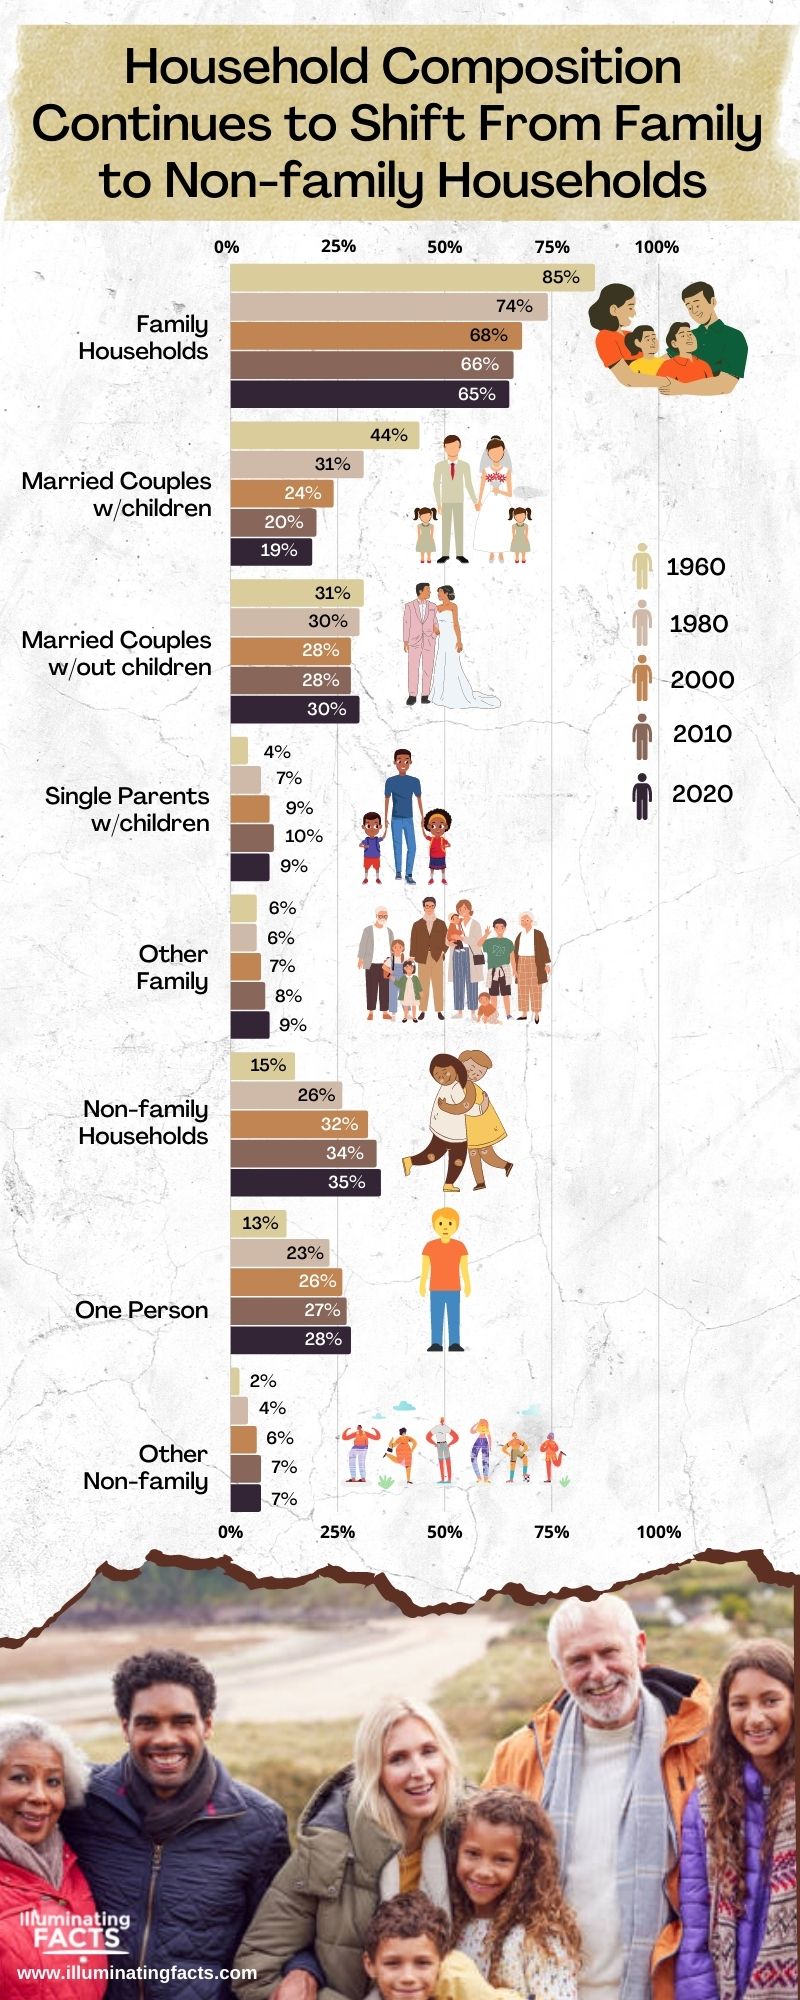
Household Composition Continues to Shift From Family to Non-family Households
In the US, the household composition has been changing from family to non-family households. 85% of people from the 1960s have been living in some form of the family household. 44% have children while 31% don’t. Other non-family households account for 15% and one person living accounts for 13% for people belonging to the 1960s. As of 2020 individuals, the trend has changed a bit and the non-family households have increased from 15% to 35%. One person living has also increased from 15% to 28%.
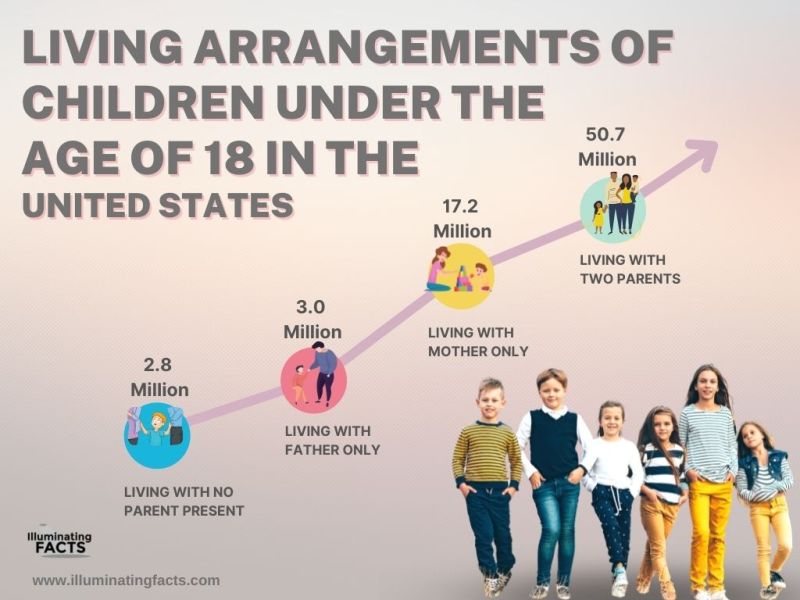
Living Arrangements of Children Under the Age of 18 in the United States
American households have a specific living arrangement for children below 18 years. After 18 years, the children usually separate from their parents and start living a new life. According to Statistics, 2.8 million children under 18 years are living with none of their parents present, unfortunately. 3 million children under 18 are living with their fathers alone. On the other hand, children under 18 living with their mothers only are 17.2 million which is almost 6 times the number of children living with their fathers. Lastly, 50.7 million children in the US live with both of their parents.
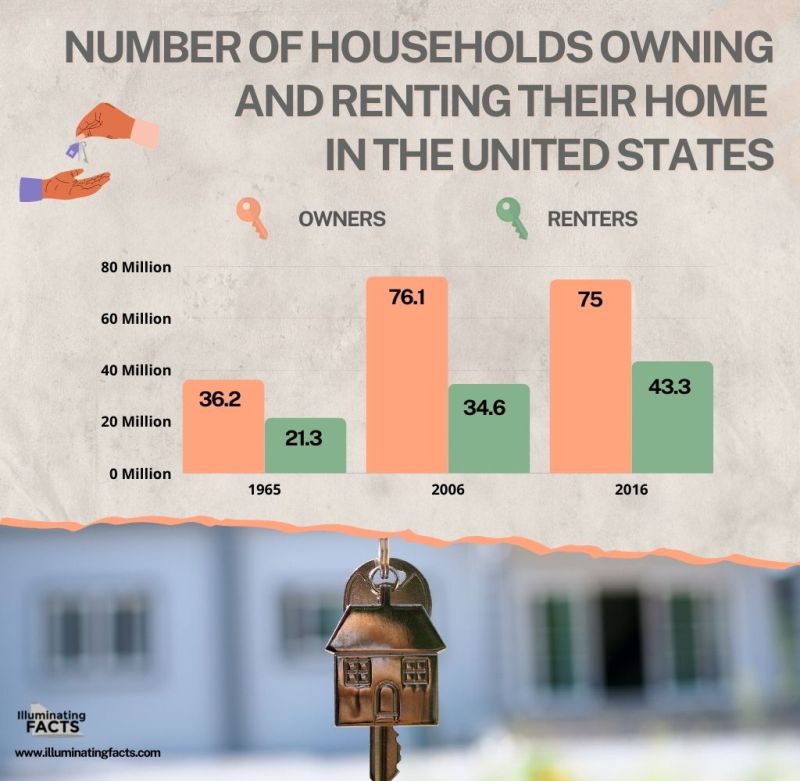
Number of Households Owning and Renting Their Home in the United States
There was a time in the US when property prices were low which is why more people became homeowners and few chose to rent a home. However, later on, the percentage of households owning homes increased but the percentage of renters increased even more. In 1965, 36.2 million households were homeowners and 21.3 million were renters. In 2006, owners increased to 76.1 million and renters increased to 34.6 million. 10 years later, the owners were 75 million, less than they were in 2006, while the renters increased to 43.3 million. This implies that the trend of renting has increased compared to the trend of owning a household.
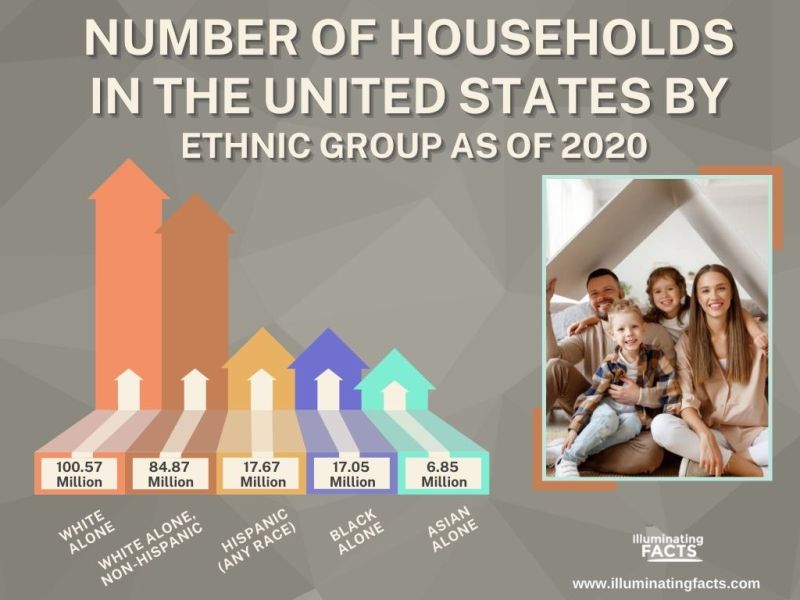
Number of Households in the United States By Ethnic Group as of 2020
Different types of Ethnic groups reside within the United States. However, most of the population of the USA is based on White Alone as they accounted for 100.57 million people in the United States. The second category is also of Whites but the Non-Hispanic ones which accounted for 84.87 million of the population of the United States. There were 17.67 million Hispanics of all races in the US as of 2020. Blacks Alone were 17.05 million while Asians were 6.85 million as of 2020. This graph shows that the US is a culturally and ethnically diverse country with multiple races co-living at the same time.

